Jacksonville Florida Real Estate Market Report
Single Family homes (attached & detached)
Active Listings: 3,438 Active Listings: 4,391
Sold: 880 Sold: 757
Months Inventory: 3.91 Months Inventory: 7.6
Average Price: 509,539 Average Price: 484,278
Inventory levels went down slightly, along with how many homes sold in Jacksonville this month versus May of this year. That made our months inventory bump up to 3.91 months. That’s not a big deal, as we are still in a seller’s market in Jacksonville. Have you heard that we are in a real estate bubble? Here’s one report about the real estate bubble. I have been doing these same market stats for Jacksonville,for about 2 years now, which has data going back to January 2010. In January 2010, we had 6,550 available homes, sold 487 homes, which gave us 13.45 months inventory. Obviously, things have changed and we are seeing more houses in Jacksonville selling. In June 2005 there were 2,392 available homes in Jacksonville and 1,100 sold, which gave us a months inventory level of 2.17 months. Then in June 2006, the inventory level jumped to 5,125, homes sold in Jacksonville dropped slightly to 1,074, which bumped up our months inventory to 4.77. So right now we are seeing better numbers than we did in June 2006, but not quite the same as June 2005. So, let’s also look at median prices as well. In June 2005, the median price was 178,000. In June 2006 it was 194,000. So the median price increased, even though the months inventory rose. June 2007, the median price was 187,630. In June 2013, the median sales price was 145,000. Also note, that in June 2012 the median sales price was 121,755.
Now, are we in a bubble? If you really think about it, the moment our prices increase we are in a bubble. The question is, how long will this bubble last before it bursts? I think the answer lies in watching the inventory levels and sold homes. Also to note, the real estate atmosphere is different now, then it was back in 2005. Buyers with lower credit scores were able to buy homes in 2005, with riskier loans like 100% financing. We are not seeing that now. Prices are not increasing like they were in 2005. Whenever you hear or read the media reporting about a real estate bubble, remember, they are trying to get people to read their news stories.
Jacksonville Florida Real Estate Market Report June 2013

And now for a Blast in the Past…………..
Jacksonville Florida Real Estate Market Report June 2012

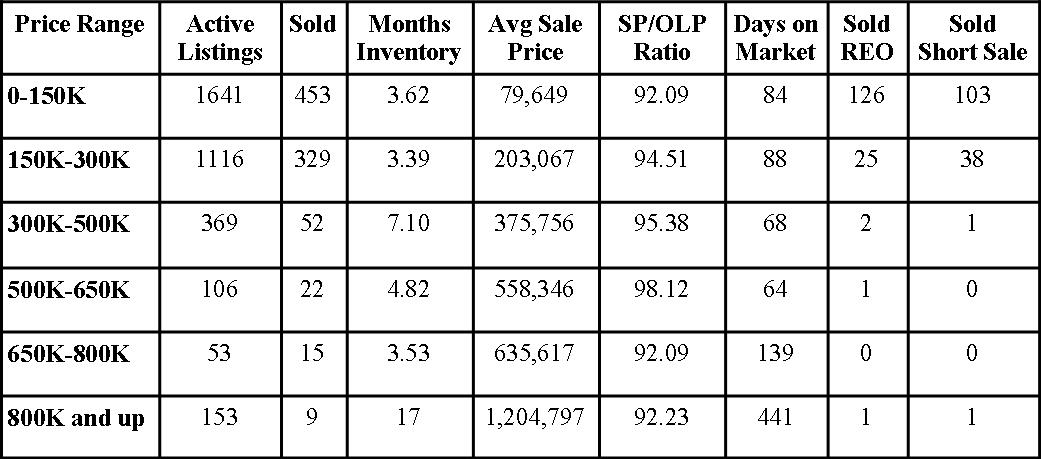
Active Listings– The amount of active listings in the month reported
Sold– The amount of sold listings that closed in the reported month.
Months Inventory– How many months it would take to sell the current inventory based on the sold amount.
Avg Sale Price– Average sale price of the sold houses in the reported month.
SP/OLP Ratio– Sales price to Original List Price, this is the percentage showing the difference of what the house was originally listed for and what it sold for.
Days on the Market– The length of time it took the house to get under contract from list date.
Sold REO– How many homes sold that were foreclosures (REO=Real Estate Owned).
Sold Short Sales– How many homes sold, that were short sales
Want to see what the real estate market looks like in your neighborhood?
FREE Home Value Report complete with current sales in the neighborhood and current homes available for sale.
If you want to search for homes in Jacksonville, check out this link: Search for homes for sale in Jacksonville Florida
Every neighborhood and house is different, want to know what these numbers mean to you when selling your Jacksonville Florida Home? Call me at 904-910-3516 and find out!