Clay County Florida Real Estate Market Report
October 2013
Single Family homes in:
Fleming Island ·Orange Park ·Middleburg · Green Cove Springs
Active Listings: 1199 Active Listings: 908
Sold: 214 Sold: 215
Months Inventory: 5.60 Months Inventory: 4.22
Average Price: 391,695 Average Price: 554,282
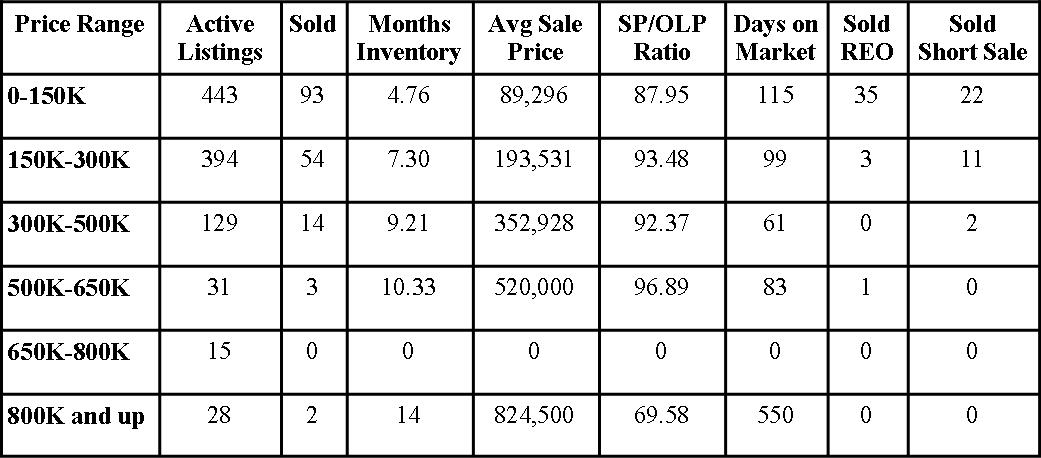
Interesting change this year. Looks like we have taken a step back in the months inventory level this October versus last year. An increase in the number of houses available in Clay County has caused us to move more towards a balanced market. I don’t think it’s a big deal, because the amount of homes sold in October in Clay County was only 1 shy of last year’s number. Houses are selling, just have a little more homes in Clay County to choose from. Let’s take a look at the median sales price. Last year the median sales price in Clay County for October 2012 was $134,450, this year it’s $165,000. That’s a 22.7% increase. For those who don’t know what median sales price is, I’ll explain using the example in October. Since the median sales price was 165k, then that means that half the homes sold were below 165k and the other half of the homes sold were above 165k. It’s a good sign to see an increase. Each neighborhood and each house is different, so if you want to see what your neighborhood is doing, then let me know. If you fill out the What’s My Home Worth form, within 24 hours and with no obligation, I’ll show you what has sold in the past 6 months, what is currently available and what has recently expired and withdrawn.
Clay County Florida Market Report October 2013
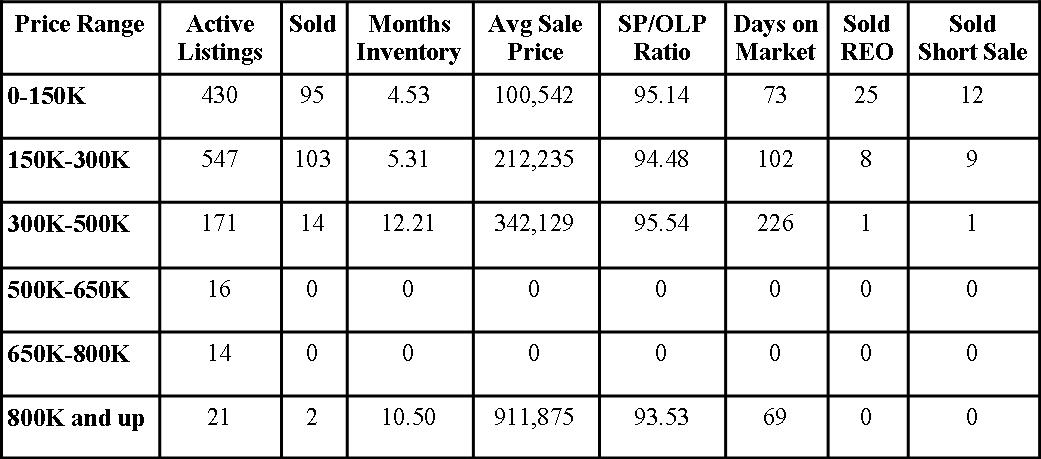 And now for a Blast in the Past…………..
Clay County Florida Market Report October 2012
Active Listings– The amount of active listings in the month reported
Sold– The amount of sold listings that closed in the reported month.
Months Inventory– How many months it would take to sell the current inventory based on the sold amount.
Avg Sale Price– Average sale price of the sold houses in the reported month.
SP/OLP Ratio– Sales price to Original List Price, this is the percentage showing the difference of what the house was originally listed for and what it sold for.
Days on the Market– The length of time it took the house to get under contract from list date.
Sold REO– How many homes sold that were foreclosures (REO=Real Estate Owned).
Sold Short Sales– How many homes sold, that were short sales
Want to see what the real estate market looks like in your neighborhood?
FREE Home Value Report complete with current sales in the neighborhood and current homes available for sale.
If you want to search for homes in Clay County, check out this link: Search for homes for sale in Clay County Florida
Want to know what these numbers mean to you when selling your Clay County Florida Home? Call me at 904-910-3516 and find out!


