Eagle Harbor Market Report November 2012
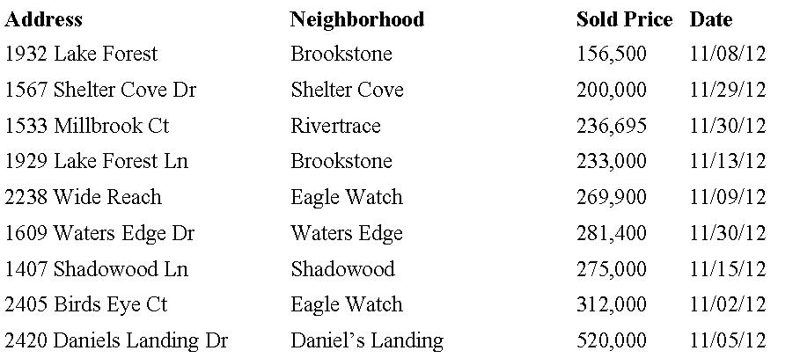
Below are the homes in Eagle Harbor that have sold in the month of November 2012. The chart below the addresses, shows the active and sold homes in Eagle Harbor, along with months inventory, days on the market and sales price to original list price ratio. You always want to know sales price to ORIGINAL list price, not sales price to list price. The original list price means, the price the house was when that agency first listed it. In the case of sales price to list price, the list price represents the price the house was listed at, when the house went under contract. So see, how the two numbers are totally different and SP vs LP does NOT paint an accurate picture. Looking at the months inventory of 6.44, it’s showing that Eagle Harbor has went back into a balanced market. It’s the holidays, I’m not surprised by that.


Active Listings– The amount of active listings in the month reported
Sold– The amount of sold listings that closed in the reported month.
Months Inventory– How many months it would take to sell the current inventory based on the sold amount.
Avg Sale Price– Average sale price of the sold houses in the reported month.
SP/OLP Ratio– Sales price to Original List Price, this is the percentage showing the difference of what the house was originally listed for and what it sold for.
Days on the Market– The length of time it took the house to get under contract from list date.
Homeowners Eagle Harbor looking to sell or just curious on what your home is worth in the current market, request a FREE Home Valuation and within 24 hours, you will receive your home valuation results, with no obligation or harassment.
Buyers, if you want to view homes for sale in Eagle Harbor, please click on the link:
Homes for sale in Eagle Harbor

