Fleming Island Real Estate Market Report October 2015
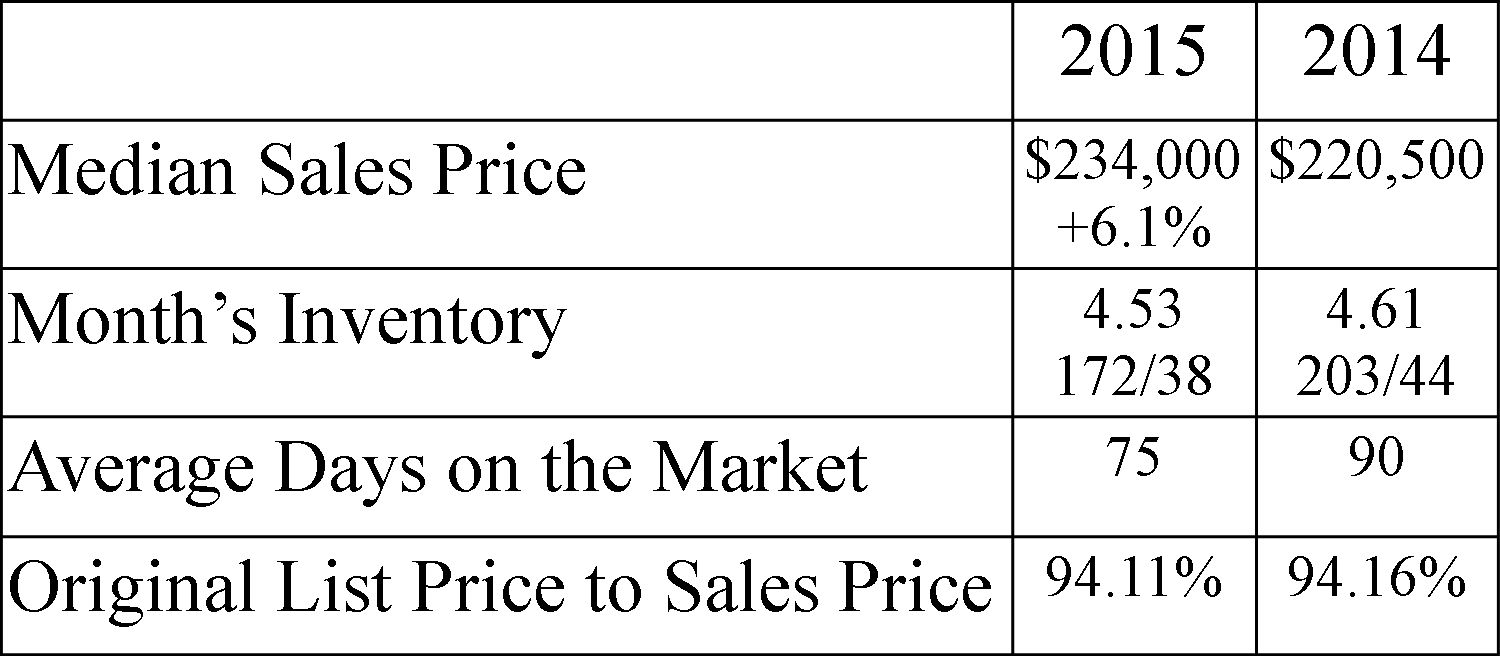
Fleming Island is still seeing improvements over last year in October. We are still experiencing a seller’s market, while leaning towards a balanced market. Check out under the graph to see what the stats mean. We are rolling around to the slower season of the year as we approach the holidays, but don’t let that keep you from putting your house on the market. What an awesome way to showcase your home, by using Christmas decorations! So if you’re curious about What your Fleming Island Florida Home is Worth, then click that link.
 Median Sales Price: Looking at sold homes it means that half the homes that sold were more than 234k and the other half were less than 234k.
Month’s Inventory: Based on the number of actives and homes that have sold it would take 4.48 months to sell the active homes, if no other homes came on the market. How to determine what type of market we are experiencing:
Buyers’ Market: More than 7 months of Inventory
Balanced Market: From 5-7 months of Inventory
Sellers’ Market: Less than 5 months of inventory
Average Days on the Market: This is the average based on the time the house came on the market until is went under contract.
Original List Price to Sales Price: This is the percentage of what the home sold for compared to what it was originally listed for. Not what it was listed for at the time it went under contract.


