St Johns County Florida Market Report
Single Family homes (attached & detached)
October 2013
Single Family homes in:
St Johns ·St Augustine ·St Augustine Beach ·Ponte Vedra ·Ponte Vedra Beach ·Palm Valley ·Nocatee· Vilano Beach
Active Listings: 1,459 Active Listings: 1365
Sold: 294 Sold: 310
Months Inventory: 4.96 Months Inventory: 4.40
Average Price: 559,234 Average Price: 559,537
Interesting to see that St Johns County is experiencing the same trend as Clay County is. Slightly more homes available and less homes sold in St Johns County in October 2013 versus October 2012.This time of year is the when we normally slow down, but I also think people being more concerned lately, with how the economy and government have been acting in recent months. I get asked frequently, is it a good time to buy a home? That’s only a question you can ask, not some real estate agent who doesn’t know YOUR situation. I can show you the market stats and homes that are for sale, but you have to determine if the time is right for you. Some things you may consider are: Do you have a down payment? How’s your credit? Do you have an emergency fund of at least 6 months? How will you pay for your closing costs? That’s just the tip of the iceberg, there are even more specific to your situation questions you need to ask yourself. Let’s not forget the median sales price stats for St Johns County. In October 2012, the median home price was $243,595. In October 2013 it was $276,000. That’s a difference of 6.7%.
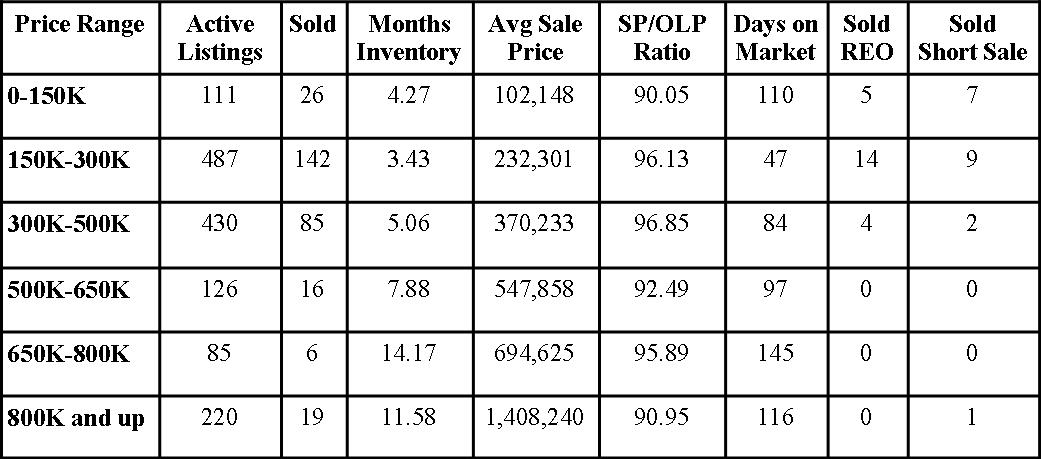
St Johns County Florida Real Estate Market Report October 2013
 And now for a Blast in the Past…………..
St Johns County Florida Real Estate Market Report October 2012 
Active Listings– The amount of active listings in the month reported
Sold– The amount of sold listings that closed in the reported month.
Months Inventory– How many months it would take to sell the current inventory based on the sold amount.
Avg Sale Price– Average sale price of the sold houses in the reported month.
SP/OLP Ratio– Sales price to Original List Price, this is the percentage showing the difference of what the house was originally listed for and what it sold for.
Days on the Market– The length of time it took the house to get under contract from list date.
Sold REO– How many homes sold that were foreclosures (REO=Real Estate Owned).
Sold Short Sales– How many homes sold, that were short sales
Want to see what the real estate market looks like in your neighborhood?
FREE Home Value Report complete with current sales in the neighborhood and current homes available for sale.
If you want to search for homes in St Johns County, check out this link:Search for homes for sale in St Johns County Florida
Want to know what these numbers mean to you when selling your St John’s County Florida Home? Call me at 904-910-3516 and find out!