Northeast Florida Life

Everything about Northeast Florida

Call or Text Pam Graham:

+1 (904) 910-3516

Follow Us on FacebookFollow Us on PinterestFollow Us on YouTube
  • Home
  • Communities
    • Homes For Sale in Duval County Florida
      • Jacksonville
    • Homes for sale in Clay County
      • Fleming Island
      • Middleburg
      • Orange Park
      • Green Cove Springs
    • Homes For Sale In St Johns County
      • St Johns
  • About
  • Contact
  • Search HomesSearch Our Map
  • Home ValuationHow Much Could I Sell For Today?
  • Northeast FloridaMarket Reports
  • Things To DoLife in Northeast Florida

How to Sell and Buy A Home at The Same Time Without Going Crazy

October 6, 2020 by Pam Leave a Comment

How to Sell and Buy A Home at The Same Time Without Going Crazy

The key word here is crazy, isn’t it? Real estate can make you a little crazy with just one transaction happening, but Cute frog trying to juggle everything without dropping anythingthrow in another one and boom! Stress levels have climbed Mount Everest, but hopefully after you read this blog post you will feel a little bit better about selling your current home and buying another one.

Here are 7 options to help you sell, then buy a home with the least amount of stress and hassle…………

  1. The ideal option is to be able to buy a house, without having to close on your current one first. You feel less rushed, and can look without that nagging feeling that you’re running out of time. Negotiations are easier, because you won’t have the contingency of having to sell before you can close on your new home. This may not always be an option of you need the proceeds of your current home to close on the next one. So………
  2.  Close on both homes on the same day. This is where you learn to juggle. Ideally, by the time you get your home on the market, you will know where you’re going and are pre-approved for a mortgage.  Once it hits the market, it’s totally ok to start looking at homes, just be aware that most sellers will not accept an offer from a buyer, who’s house is not under contract. Especially in this current seller’s market. The good thing is, it’s a seller’s market, so as long as your house is priced well and not ugly, you should go under contract quickly. Once you’re under contract, there’s double the work! Inspections and appraisals on both houses at the same time. That’s where I come in, so don’t worry about the details. That’s my job.
  3. You can sell, then rent. Either short term or longer. The options for short term rentals are lower, but there are some out there, or we can ask for a landlord to make an exception. That could mean offering a little extra on the monthly rent than what’s advertised.
  4. Sell and live with family. No, I didn’t hit my head. I know living with family can be, um, horrible, I mean awesome, but you may be able to save some money, and you never know, it could be fun!!! 😁
  5. Sell and live in a hotel. This is usually a very short term thing, like let’s say your closing on your new home is a couple weeks after your current home closing. A couple weeks in a hotel can be a pain, but think of it as a mini vacation. Where you still go to work and live out of a suitcase.
  6. Make the offer on your current home contingent on you finding a new home. Like 30 days and then after 30 days, you and your buyer can extend it, close without having a new house (rent) or start over with a new buyer. Or even say forget it, if it has been way too much.
  7. Do a 30 day lease back from the buyer. So, ideally you close on your current home and once it closes, you have 30 days to find another house. Maybe a free 30 days with just a deposit that covers any damages to the house.

There’s alot of options above, but I won’t play and act like it will be a piece of cake. You will probably want to eat cakeMy offer of a cake after closing on not one home, but two! when it’s over.

If you’re thinking about selling and/or buying a house and have questions, then you’ve come to the right place! I am a local realtor in the Northeast area covering Jacksonville, Clay and St John’s County and I LOVE questions. Call or text me at 904-910-3516. No obligation or pressure. I don’t like it done to me, and won’t do it to you.


What’s My Northeast Florida Home Worth?

Also, check out my free guides for buyers and sellers below.

📕 Free Guides on the Home Buying & Selling process: 📕

Free Home Seller Guides
The Ultimate Home Seller's Guide
Preparing Your Home For Sale
Selling A House During A Divorce
Free Home Buyer Guides:
The Ultimate Guide for First-Time Homebuyers
Does Owning A Home Make More Sense Than Renting?
Beware of the Pitfalls of Attending Open Houses
The Ultimate Relocation Guide
The Ultimate Home Buyer's Guide
Should You Hire An Agent When Buying New Construction?
Go to top

Homes For Sale in Jacksonville

Homes For Sale in Orange Park

Homes For Sale in Fleming Island

Homes For Sale in Green Cove Springs

Homes For Sale in Middleburg

Homes For Sale in St Johns County

Filed Under: Sellers Tagged With: clay county real estate, green cove springs, homes for sale in fleming island, homes for sale in green cove springs, homes for sale in jacksonville, homes for sale in northeast florida, jacksonville florida real estate, st johns county real estate

Down Payment Assistance Programs in Northeast Florida

September 14, 2020 by Pam Leave a Comment

Down Payment Assistance Programs in Northeast Florida

 
This represents buying a home with a key in the door

Sometimes that can seem a little overwhelming or you might think you need a ton of money to buy a home. Not so at all.  Right now, there are around 5 different programs. I won’t go through all of them in this blog, but, check this link with the a flyer of the various programs:

Down Payment Assistance Programs


Some can be in the form of a 2nd mortgage. Some are forgiven and some are not. Forgiven? You’re wondering if you have to give some kind of confession aren’t you? Nope, no worries you’re good, that’s not the kind of forgiveness I’m talking about. 🤣 🤣


Forgiven means that after a certain set are terms or rules are met, you no longer owe the down payment assistance portion. So for example, one program is 3 or 4% of the purchase price that will go towards your down payment. After 5 years you won’t owe that 3-4% anymore. If you sell before 5 years, you will have to pay it back. Some can be a fully amortized 2nd mortgage or never forgiven and will have to be paid off when you sell your house. Some of the funds can be used towards your closing costs as well. Or you can ask for the seller to contribute towards your closing costs.


There are other restrictions like what type of loan you can use, income and housing price, which vary based on which program you use.

Normally, I would point you in the direction of your bank, but chances are they don’t work with down payment assistance programs or if they do, they only utilize one. So I am going to recommend you give Lisa Daniels a call. She is the down payment assistance expert and knows multiple programs that can work for your situation. Her contact info is:


Lisa Daniels Academy Mortgage: 904-219-1417 Don’t forget to tell her Pam Graham sent you!


Thank you for making your way here! I give away free guides that talk about the home buying and selling process. Just look below and you will find them listed there.

📕 Free Guides on the Home Buying & Selling process: 📕

Free Home Buyer Guides:
The Ultimate Guide for First-Time Homebuyers
Does Owning A Home Make More Sense Than Renting?
Beware of the Pitfalls of Attending Open Houses
The Ultimate Relocation Guide
The Ultimate Home Buyer's Guide
Should You Hire An Agent When Buying New Construction?


Free Home Seller Guides
The Ultimate Home Seller's Guide
Preparing Your Home For Sale
Selling A House During A Divorce
Go to top

Homes For Sale in Jacksonville

Homes For Sale in Orange Park

Homes For Sale in Fleming Island

Homes For Sale in Green Cove Springs

Homes For Sale in Middleburg

Homes For Sale in St Johns County

Filed Under: Home Buying Tips Tagged With: clay county real estate, first time home buyers, home buying tips, homes for sale in fleming island, homes for sale in green cove springs, homes for sale in jacksonville, homes for sale in middleburg, homes for sale in northeast florida, homes for sale in orange park, homes for sale in st johns county, jacksonville florida real estate, jacksonville homes for sale

Jacksonville Florida Real Estate Market Report April 2013

June 14, 2013 by Pam 2 Comments

Jacksonville Florida Real Estate Market Report

 Single Family homes (attached & detached)

 April 2013                    April 2012

Active Listings: 3,653                Active Listings: 4,527

Sold:  918                              Sold: 694

Months Inventory: 3.98           Months Inventory: 6.52

Average Price: 505,182           Average Price: 550,721

Wow. That’s what I said out loud when I saw this month’s inventory level under 4 months. Last month it was 4.36. To put it in perspective, back in April 2005, it was 2.43 months. Now, if you’re new to my market reports or not sure what months inventory means, I’ll explain. If we use April 2013 as the example, then we see that there was 3,653 available houses and 918 houses sold and closed that month. If you divide active houses by sold houses, then you will get 3.98. So, that’s the math part. What it means, is it would take 3.98 months to sell 3,653 based on 918 homes sold and if no more houses came on the market. We are in a seller’s market. Woohoo sellers!

 Jacksonville Florida Real Estate Market Report April 2013

jax april 2013

 And now for a Blast in the Past…………..

 Jacksonville Florida Real Estate Market Report April 2012

jax april 2012 

Active Listings– The amount of active listings in the month reported

Sold– The amount of sold listings that closed in the reported month.

Months Inventory– How many months it would take to sell the current inventory based on the sold amount.

Avg Sale Price– Average sale price of the sold houses in the reported month.

SP/OLP Ratio– Sales price to Original List Price, this is the percentage showing the difference of what the house was originally listed for and what it sold for.

Days on the Market– The length of time it took the house to get under contract from list date.

Sold REO– How many homes sold that were foreclosures (REO=Real Estate Owned).

Sold Short Sales– How many homes sold, that were short sales


Want to see what the real estate market looks like in your neighborhood?

FREE Home Value Report  complete with current sales in the neighborhood and current homes available for sale.

If you want to search for homes in Jacksonville, check out this link: Search for homes for sale in Jacksonville Florida

Every neighborhood and house is different, want to know what these numbers mean to you when selling your Jacksonville Florida Home? Call me at 904-910-3516 and find out!

Filed Under: Jacksonville Florida Market Report Tagged With: jacksonville florida market report, jacksonville florida real estate

Jacksonville Florida Real Estate: Market Report March 2013

March 8, 2013 by Pam Leave a Comment

Jacksonville Florida Real Estate Market Report

 Single Family homes (attached & detached)


March 2013                    March 2012

Active Listings: 3,489                Active Listings: 4,748

Sold: 800                                Sold: 773

Months Inventory: 4.36            Months Inventory: 6.14

Average Price: 492,098           Average Price: 469,246

Last year when I did the market stats for March 2012, I wondered what March 2013 would be like. I had a feeling we would see a seller’s market and that’s exactly what we are seeing right now. I also had mentioned that in 2005, there were 2,549 available homes and 1,052 sold homes in Jacksonville. That made the inventory level around 2.42 months. So, in today’s real estate market last month, we had 940 more houses available and 252 less homes sold then we did in 2005. I really hope it doesn’t get that crazy again.

 Jacksonville Florida Real Estate Market Report March 2013

Jacksonville Florida Real Estate: Market Report March 2013

 And now for a Blast in the Past…………..

 Jacksonville Florida Real Estate Market Report March 2012

Jacksonville Florida Real Estate: Market Report March 2012

Active Listings– The amount of active listings in the month reported

Sold– The amount of sold listings that closed in the reported month.

Months Inventory– How many months it would take to sell the current inventory based on the sold amount.

Avg Sale Price– Average sale price of the sold houses in the reported month.

SP/OLP Ratio– Sales price to Original List Price, this is the percentage showing the difference of what the house was originally listed for and what it sold for.

Days on the Market– The length of time it took the house to get under contract from list date.

Sold REO– How many homes sold that were foreclosures (REO=Real Estate Owned).

Sold Short Sales– How many homes sold, that were short sales


Want to see what the real estate market looks like in your neighborhood?

FREE Home Value Report  complete with current sales in the neighborhood and current homes available for sale.

If you want to search for homes in Jacksonville, check out this link: Search for homes for sale in Jacksonville Florida

Every neighborhood and house is different, want to know what these numbers mean to you when selling your Jacksonville Florida Home? Call me at 904-910-3516 and find out!


Filed Under: Jacksonville Florida Market Report Tagged With: jacksonville florida real estate, jacksonville real estate market

Jacksonville Florida Real Estate: Market Report February 2013

February 28, 2013 by Pam Leave a Comment

Jacksonville Florida Real Estate Market Report

 Single Family homes (attached & detached)


February 2013                     February 2012

Active Listings: 3,520                Active Listings: 4,748

Sold: 689                                Sold: 603

Months Inventory: 5.11           Months Inventory:  7.87

Average Price: 499,230          Average Price: 536,431

The average price took a slight stumble back from last month, and the months inventory in Jacksonville went down, which is a positive thing in the case of sellers. More homes sold and less inventory is putting Jacksonville real estate market in a seller’s market. If this trend continues, I don’t see why it won’t, then we will see prices start to rise. Just remember though, each house and each neighborhood are different. To really determine how it’s looking for your house, we need to take a closer look at your neighborhood stats.

 Jacksonville Florida Real Estate Market Report February 2013

Jacksonville Florida Real Estate: Market Report February 2013

 And now for a Blast in the Past…………..

 Jacksonville Florida Real Estate Market Report February 2012

Jacksonville Florida Real Estate: Market Report February 2012

Active Listings– The amount of active listings in the month reported

Sold– The amount of sold listings that closed in the reported month.

Months Inventory– How many months it would take to sell the current inventory based on the sold amount.

Avg Sale Price– Average sale price of the sold houses in the reported month.

SP/OLP Ratio– Sales price to Original List Price, this is the percentage showing the difference of what the house was originally listed for and what it sold for.

Days on the Market– The length of time it took the house to get under contract from list date.

Sold REO– How many homes sold that were foreclosures (REO=Real Estate Owned).

Sold Short Sales– How many homes sold, that were short sales


Want to see what the real estate market looks like in your neighborhood?

FREE Home Value Report  complete with current sales in the neighborhood and current homes available for sale.

If you want to search for homes in Jacksonville, check out this link: Search for homes for sale in Jacksonville Florida

Every neighborhood and house is different, want to know what these numbers mean to you when selling your Jacksonville Florida Home? Call me at 904-910-3516 and find out!


Filed Under: Jacksonville Florida Market Report Tagged With: jacksonville florida, jacksonville florida market report, jacksonville florida real estate

Jacksonville Florida Real Estate: Market Report January 2013

January 30, 2013 by Pam Leave a Comment

 Jacksonville Florida Real Estate Market Report

 Single Family homes (attached & detached)


January 2013                     January 2012

Active Listings: 3,432                Active Listings: 4,691

Sold: 658                           Sold: 606

Months Inventory: 5.22          Months Inventory: 7.74

Average Price: 506,572          Average Price: 389,472

I remember writing up the report last year around this time for January 2012 and I was happy to see that the months inventory had dropped to 7.74. January 2011, the months inventory was 13.45! Wow, what a huge difference. In case you’re wondering what months inventory means, let me explain it to you. 🙂 In the case of January 2013 stats, it would take the active listings of 3,432 about 5.22 months to sell, based on the 658 hones that did sell. When inventory levels are around 6 months, we are experiencing a stable market. Above that, then we are looking at a buyer’s market and below, a seller’s market. So, in two years we went from a large buyer’s market, to now dipping into a seller’s market. What a difference 2 years can make.

 Jacksonville Florida Real Estate Market Report January 2013

Jacksonville Florida Real Estate: Market Report January 2013

 And let’s rewind by a year…………..

 Jacksonville Florida Real Estate Market Report January 2012

Jacksonville Florida Real Estate: Market Report January 2012

Active Listings– The amount of active listings in the month reported

Sold– The amount of sold listings that closed in the reported month.

Months Inventory– How many months it would take to sell the current inventory based on the sold amount.

Avg Sale Price– Average sale price of the sold houses in the reported month.

SP/OLP Ratio– Sales price to Original List Price, this is the percentage showing the difference of what the house was originally listed for and what it sold for.

Days on the Market– The length of time it took the house to get under contract from list date.

Sold REO– How many homes sold that were foreclosures (REO=Real Estate Owned).

Sold Short Sales– How many homes sold, that were short sales

 Want to see what the real estate market looks like in your neighborhood?

FREE Home Value Report  complete with current sales in the neighborhood and current homes available for sale.

If you want to search for homes in Jacksonville, check out this link: Search for homes for sale in Jacksonville Florida

Every neighborhood and house is different, want to know what these numbers mean to you when selling your Jacksonville Florida Home? Call me at 904-910-3516 and find out!


Filed Under: Jacksonville Florida Market Report Tagged With: jacksonville florida, jacksonville florida market report, jacksonville florida real estate

Jacksonville Florida Real Estate: Market Report December 2012

December 30, 2012 by Pam Leave a Comment

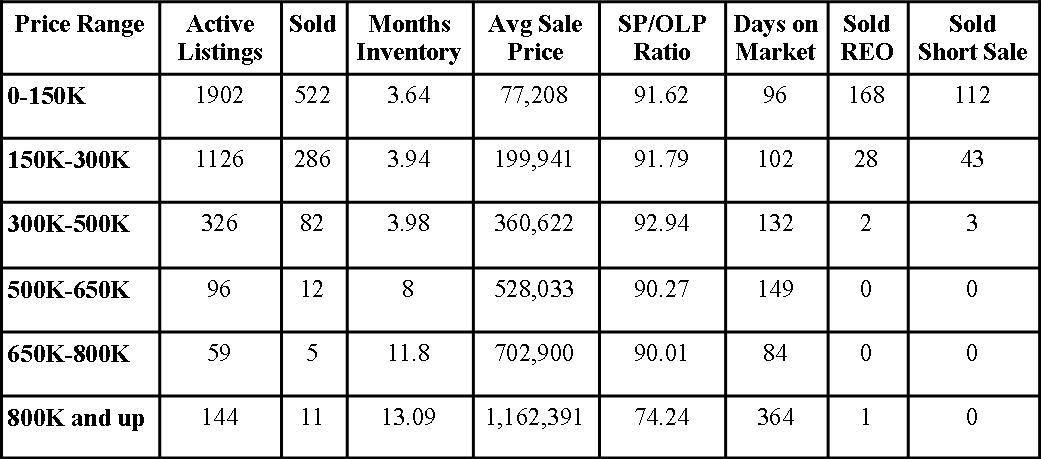
Jacksonville Florida Real Estate Market Report

 Single Family homes (attached & detached)

December 2012

Christmas Time

 December 2012                     December 2011

Active Listings:  3,703               Active Listings: 5,071

Sold:  775                              Sold: 709

Months Inventory: 4.78           Months Inventory:  7.15

Average Price:  546,968         Average Price: 528,749

1,368 is the difference between December 2011 and December 2012 in active listings! That’s a huge difference and shows that in December we have dipped down into a seller’s market based on the 4.78 months inventory. 6 months of inventory is a balanced market. We also seen an increase in the average price, which I know homeowners want to see that trend continue.

 Jacksonville Florida Real Estate Market Report December 2012

Jacksonville Florida Real Estate: Market Report December 2012

 And now for a Blast in the Past…………..

 Jacksonville Florida Real Estate Market Report December 2011

Jacksonville Florida Real Estate: Market Report December 2011

Active Listings– The amount of active listings in the month reported

Sold– The amount of sold listings that closed in the reported month.

Months Inventory– How many months it would take to sell the current inventory based on the sold amount.

Avg Sale Price– Average sale price of the sold houses in the reported month.

SP/OLP Ratio– Sales price to Original List Price, this is the percentage showing the difference of what the house was originally listed for and what it sold for.

Days on the Market– The length of time it took the house to get under contract from list date.

Sold REO– How many homes sold that were foreclosures (REO=Real Estate Owned).

Sold Short Sales– How many homes sold, that were short sales


Want to see what the real estate market looks like in your neighborhood?

FREE Home Value Report  complete with current sales in the neighborhood and current homes available for sale.

If you want to search for homes in Jacksonville, check out this link: Search for homes for sale in Jacksonville Florida

Want to know what these numbers mean to you when selling your Jacksonville Florida Home? Call me at 904-910-3516 and find out!


Filed Under: Jacksonville Florida Market Report Tagged With: jacksonville florida, jacksonville florida market report, jacksonville florida real estate

Jacksonville Florida Real Estate: Market Report November 2012

November 30, 2012 by Pam Leave a Comment

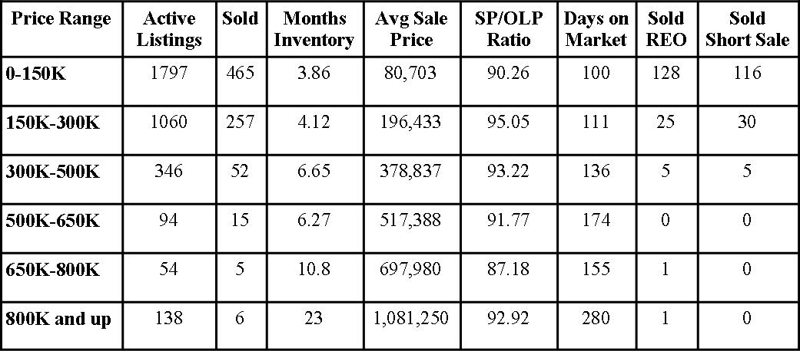
Jacksonville Florida Real Estate Market Report

 Single Family homes (attached & detached)

November 2012

Jacksonville Jaguars

 November 2012                     November 2011

Active Listings: 3,918                Active Listings: 5,191

Sold: 761                               Sold: 565

Months Inventory: 5.15           Months Inventory:  9.19

Average Price:  495,555         Average Price: 453,920

The dipping into the seller’s market in Jacksonville Florida continues folks! Great news for the first coast. Lower inventory and more homes sold is moving us into the right direction. Great interest rates and buyer confidence will help continue this trend as we move into the new year.

I want to point out the column marked: SP/OLP Ratio. That stands for sales price to original list price, which is the percentage of what the home sold for versus what it was originally listed for. In November 2011, we saw one price range above 90%, but in November 2012, we see 4 different price ranges above 90%. This shows us that houses are selling closer to what they were originally listed for.


 Jacksonville Florida Real Estate Market Report November 2012

Jacksonville Florida Real Estate: Market Report November 2012

 And now for a Blast in the Past…………..

 Jacksonville Florida Real Estate Market Report November 2011

Jacksonville Florida Real Estate: Market Report November 2011

Active Listings– The amount of active listings in the month reported

Sold– The amount of sold listings that closed in the reported month.

Months Inventory– How many months it would take to sell the current inventory based on the sold amount.

Avg Sale Price– Average sale price of the sold houses in the reported month.

SP/OLP Ratio– Sales price to Original List Price, this is the percentage showing the difference of what the house was originally listed for and what it sold for.

Days on the Market– The length of time it took the house to get under contract from list date.

Sold REO– How many homes sold that were foreclosures (REO=Real Estate Owned).

Sold Short Sales– How many homes sold, that were short sales


Want to see what the real estate market looks like in your neighborhood?

FREE Home Value Report  complete with current sales in the neighborhood and current homes available for sale.

If you want to search for homes in Jacksonville, check out this link: Search for homes for sale in Jacksonville Florida

Want to know what these numbers mean to you when selling your Jacksonville Florida Home? Call me at 904-910-3516 and find out!


Filed Under: Jacksonville Florida Market Report Tagged With: jacksonville florida, jacksonville florida market report, jacksonville florida real estate

Jacksonville Florida Real Estate: Market Report October 2012

October 30, 2012 by Pam Leave a Comment

Jacksonville Florida Real Estate Market Report

 Single Family homes (attached & detached)

October 2012

Downtown Jacksonville


October 2012                     October 2011

Active Listings:  3,936               Active Listings: 5,213

Sold: 743                               Sold: 532

Months Inventory: 5.30           Months Inventory:  9.8

Average Price: 603,920          Average Price: 529,228

What a difference a year can make! Over 1200 less in inventory and sold about 200 more in Jacksonville this month versus October 2011. The months inventory of 5.3 months means we have stabled and are dipping into a seller’s market. Look at the price point of 150k and below, we have a sellers market in that price range folks!

 Jacksonville Florida Real Estate Market Report October 2012

Jacksonville Florida Real Estate: Market Report October 2012

 And now for a Blast in the Past…………..

 Jacksonville Florida Real Estate Market Report October 2011

Jacksonville Florida Real Estate: Market Report October 2011

Active Listings– The amount of active listings in the month reported

Sold– The amount of sold listings that closed in the reported month.

Months Inventory– How many months it would take to sell the current inventory based on the sold amount.

Avg Sale Price– Average sale price of the sold houses in the reported month.

SP/OLP Ratio– Sales price to Original List Price, this is the percentage showing the difference of what the house was originally listed for and what it sold for.

Days on the Market– The length of time it took the house to get under contract from list date.

Sold REO– How many homes sold that were foreclosures (REO=Real Estate Owned). 

Sold Short Sales– How many homes sold, that were short sales


Want to know what these numbers mean to you when selling your Jacksonville Florida Home? Call me at 904-910-3516 and find out!


Filed Under: Jacksonville Florida Market Report Tagged With: jacksonville florida, jacksonville florida market report, jacksonville florida real estate

Jacksonville Florida Real Estate: Market Report September 2012

September 30, 2012 by Pam Leave a Comment

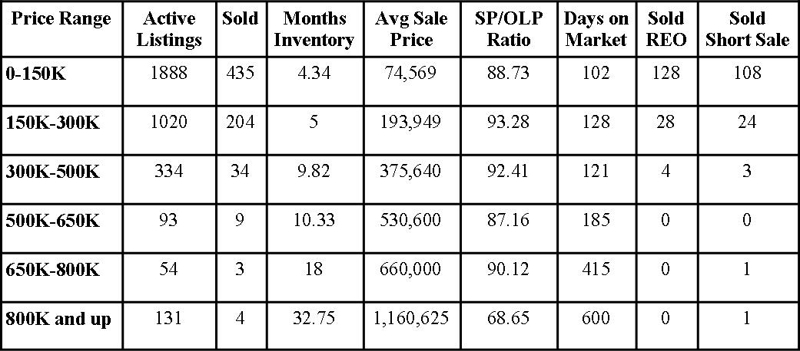
Jacksonville Florida Real Estate Market Report

 Single Family homes (attached & detached)

September 2012

Monkeys


September 2012                     September 2011

Active Listings: 3,966              Active Listings: 5,379

Sold:  635                            Sold: 631

Months Inventory: 6.25           Months Inventory: 8.52

Average Price: 520,748          Average Price: 518,329

Love to see 1,413 less homes for sell this year, then last year in Sept 2011! Heading into fall, we are seeing a stable market and that’s good news. Fall and winter tend to be our slower market, but if you’re a seller thinking of selling now, I wouldn’t let the slower months deter you. The buyers who are looking now and closer to the holidays, are serious buyers. Think about it. The holidays are busy, lots of activities going on. Who really has time to look for a house then? Well, buyers who need to move ASAP!

 Jacksonville Florida Real Estate Market Report September 2012

Jacksonville Florida Real Estate: Market Report September 2012

 And now for a Blast in the Past…………..

 Jacksonville Florida Real Estate Market Report September 2011

Jacksonville Florida Real Estate: Market Report September 2011

Active Listings– The amount of active listings in the month reported

Sold– The amount of sold listings that closed in the reported month.

Months Inventory– How many months it would take to sell the current inventory based on the sold amount.

Avg Sale Price– Average sale price of the sold houses in the reported month.

SP/OLP Ratio– Sales price to Original List Price, this is the percentage showing the difference of what the house was originally listed for and what it sold for.

Days on the Market– The length of time it took the house to get under contract from list date.

Sold REO– How many homes sold that were foreclosures (REO=Real Estate Owned). 

Sold Short Sales– How many homes sold, that were short sales


Want to know what these numbers mean to you when selling your Jacksonville Florida Home? Call me at 904-910-3516 and find out!


Filed Under: Jacksonville Florida Market Report Tagged With: jacksonville florida, jacksonville florida market report, jacksonville florida real estate

  • « Previous Page
  • 1
  • 2
  • 3
  • 4
  • 5
  • Next Page »
[maxbutton id="1"]
What’s My Home Worth?

Let’s Connect

Follow Us on FacebookFollow Us on Google+Follow Us on YouTube

Recent Posts

  • Jacksonville Fl Real Estate Market Update March 2025
  • New Construction Homes in Northeast Florida
  • St Johns County Fl Real Estate Market Update February 2025
  • Clay County Fl Real Estate Market Update February 2025
  • Jacksonville Fl Real Estate Market Update February 2025

Categories

  • Clay County Animal Care & Control
  • Clay County Florida Market Report
  • Clay County Schools
  • Foreclosures and Short Sales
  • Gardening and Landscaping in Northeast Florida
  • Home Buying Tips
  • Home Staging Advice
  • Homes for Sale
  • Jacksonville Florida Market Report
  • Local Information
  • Market Reports for Lake Asbury Neighborhoods
  • Monday Motivation
  • Neighborhoods in Fleming Island
  • Neighborhoods in Lake Asbury
  • Neighborhoods in Northeast Florida
  • Neighborhoods in Orange Park
  • Northeast Florida Market Reports
  • Nothing related to real estate
  • Photo of the Week
  • Sellers
  • Short Sale Success Stories
  • St Johns County Florida Market Report
  • Things to do in Northeast Florida
  • Uncategorized
  • Whats My Home Worth?

Archives

Contact

caricature (711x763)

Pam Graham

904-910-3516

pam@pamgraham.com

AREO, Inc. Logo - White 650

logo-realtor

About the Agent

Hello! My name is Pam Graham and I’m a full time real estate agent with All Real Estate Options. I’ve been in the business helping folks buy and sell since 2002. Read More…

Copyright © 2016 All Rights Reserved

Curb Appeal Theme