Jacksonville Single-Family Home Prices: Market Update Without the Hype October 2025

This report covers single family homes in Jacksonville, not all of Duval County, or all of Northeast Florida. I specify this, because of seeing reports showing different numbers in the media. They are all pulled from the same source, which is Northeast Florida Association of REALTORS®️. That is the same source I pull from, but I use more filters. Like only single family homes, no condos. Jacksonville, not all of Duval. I don’t combine the 3 counties I work in together. St Johns County will have a higher median sales price than Duval and Clay, so that will mess with the numbers. I mention this, because of how the numbers are being played out in the media.
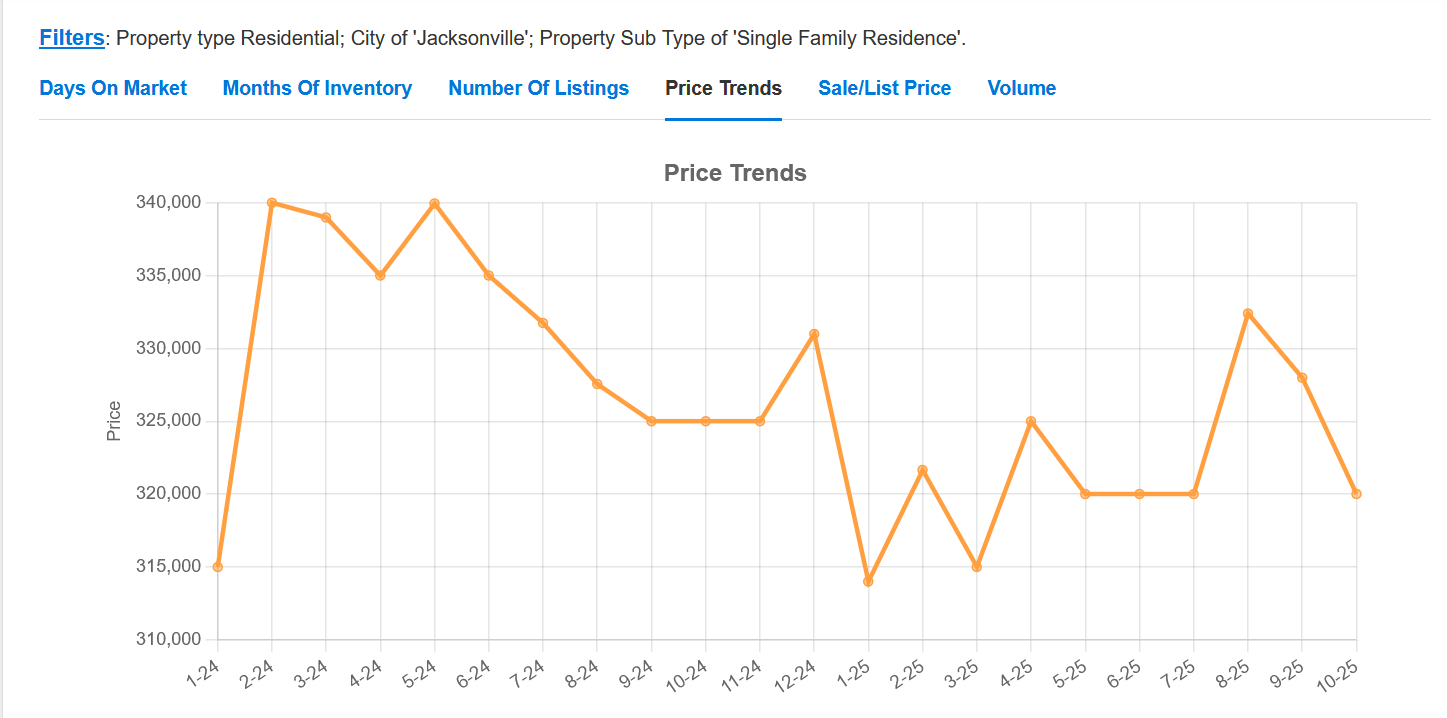
The median sales price in Jacksonville is 1.54% less this October than in October 2024. This does not indicate a crash coming, maybe just a correction. I mention this as well, because of people saying worse than 2008 is coming soon. Like they know. Seriously, I don’t know either. I just watch the current numbers and trends, then discuss what they look like without adding hyperbole headlines. Like this one about how the home prices will drop worse than 2008. There is a 50/50 chance she’s right. Just remember, extreme headlines gets more clicks and real estate is local.
This chart shows the price trend of single family homes sold in Jacksonville between January 2024, until October 2025. The real estate market goes in the way of a roller coaster, it will be interesting and telling what the spring and summer markets bring in 2026.
If we are honest tho, a 50 year mortgage or interest rate portability will not make home ownership more affordable. The two things that will, is higher incomes and price corrections. Oh, and inflation to go down, so there really is 3 things.
What’s My Home Worth?
Thinking of selling your home? Click below to complete a form, then receive a market analysis within 24 hours.
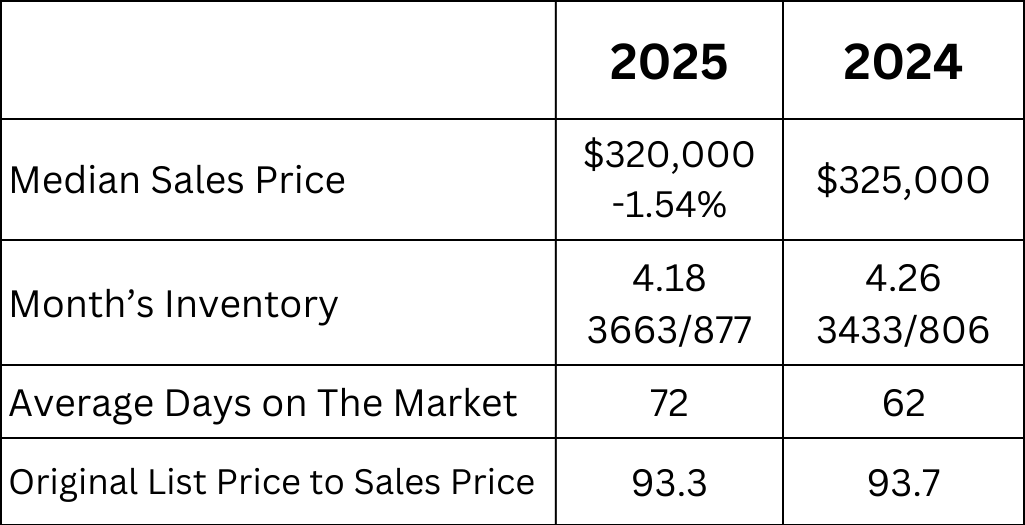
Median Sales Price: Looking at sold homes it means that half the homes that sold were more than 320,000 and the other half were less than 320,000.
Month’s Inventory: Based on the number of actives and homes that have sold it would take 4.18 months to sell the active homes, if no other homes came on the market. How to determine what type of market we are experiencing:
Buyers’ Market: More than 7 months of Inventory
Balanced Market: From 5-7 months of Inventory
Sellers’ Market: Less than 5 months of inventory
Average Days on the Market: This is the average based on the time the house came on the market until is went under contract.
Original List Price to Sales Price: This is the percentage of what the home sold for compared to what it was originally listed for. Not what it was listed for at the time it went under contract.