Jacksonville Florida Real Estate: Market Report March 2013

thumb-img
0 Comments

Jacksonville Florida Real Estate Market Report

 Single Family homes (attached & detached)


March 2013                    March 2012

Active Listings: 3,489                Active Listings: 4,748

Sold: 800                                Sold: 773

Months Inventory: 4.36            Months Inventory: 6.14

Average Price: 492,098           Average Price: 469,246

Last year when I did the market stats for March 2012, I wondered what March 2013 would be like. I had a feeling we would see a seller’s market and that’s exactly what we are seeing right now. I also had mentioned that in 2005, there were 2,549 available homes and 1,052 sold homes in Jacksonville. That made the inventory level around 2.42 months. So, in today’s real estate market last month, we had 940 more houses available and 252 less homes sold then we did in 2005. I really hope it doesn’t get that crazy again.

 Jacksonville Florida Real Estate Market Report March 2013

Jacksonville Florida Real Estate: Market Report March 2013

 And now for a Blast in the Past…………..

 Jacksonville Florida Real Estate Market Report March 2012

Jacksonville Florida Real Estate: Market Report March 2012

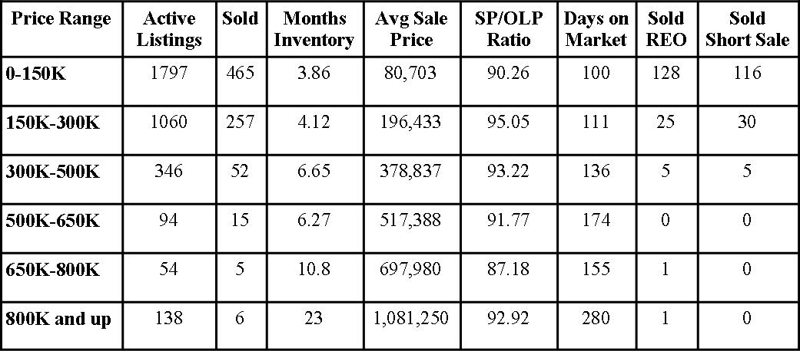
Active Listings– The amount of active listings in the month reported

Sold– The amount of sold listings that closed in the reported month.

Months Inventory– How many months it would take to sell the current inventory based on the sold amount.

Avg Sale Price– Average sale price of the sold houses in the reported month.

SP/OLP Ratio– Sales price to Original List Price, this is the percentage showing the difference of what the house was originally listed for and what it sold for.

Days on the Market– The length of time it took the house to get under contract from list date.

Sold REO– How many homes sold that were foreclosures (REO=Real Estate Owned).

Sold Short Sales– How many homes sold, that were short sales


Want to see what the real estate market looks like in your neighborhood?

FREE Home Value Report  complete with current sales in the neighborhood and current homes available for sale.

If you want to search for homes in Jacksonville, check out this link: Search for homes for sale in Jacksonville Florida

Every neighborhood and house is different, want to know what these numbers mean to you when selling your Jacksonville Florida Home? Call me at 904-910-3516 and find out!


Categories:

Leave a Reply

Your email address will not be published. Required fields are marked *

This site uses Akismet to reduce spam. Learn how your comment data is processed.

976 Deer Chase Dr St. Augustine Fl 32086
976 Deer Chase Dr St. Augustine Fl 32086 Welcome home—where the drive in sets the
St Johns County Real Estate Market Update St. Johns County FL Market Report: December Surge Now, New-Year Shift Next
St. Johns County FL Market Report: December Surge Now, New-Year Shift Next The trend is
Clay County Florida Real Estate Market December Clay County Real Estate: Serious Buyers, Homestead Rush, and What’s Next for 2026
December Clay County Real Estate: Serious Buyers, Homestead Rush, and What’s Next for 2026 We
Jacksonville Florida Real Estate Market Update Jacksonville Market Update: Inventory Drops, Prices Hold Steady, 2026 Ahead
Jacksonville Market Update: Inventory Drops, Prices Hold Steady, 2026 Ahead The last report for Jacksonville
St Johns County Real Estate Market Update St. Johns County Market November Update: Median Price Down, Buyers Getting More Breathing Room
St. Johns County Market November Update: Median Price Down, Buyers Getting More Breathing Room The
Clay County Real Estate Market Update Clay County Market Update: Median Price Drops 5.5%—What It Means for Buyers & Sellers
Clay County Market Update: Median Price Drops 5.5%—What It Means for Buyers & Sellers What
Jacksonville Florida Real Estate Market Update Jacksonville Real Estate Snapshot: Median Price Hits $325K Two Novembers in a Row
Jacksonville Real Estate Snapshot: Median Price Hits $325K Two Novembers in a Row The first
“Illustration comparing 30-year vs 50-year mortgage with different stacks of coins and a house in the middle 50-Year Mortgage vs 30-Year: I Ran the Numbers So You Don’t Have To
50-Year Mortgage vs 30-Year: I Ran the Numbers So You Don’t Have To I’m sure
October 2025 St. Johns County Housing Market Update: 410 Homes Sold Again & Prices Edge Up
October 2025 Housing Market Update: 410 Homes Sold Again & Prices Edge Up The interesting
Clay County Real estate market update Clay County FL Market Snapshot: Prices Up Slightly, Sales Steady in 2025
Clay County FL Market Snapshot: Prices Up Slightly, Sales Steady in 2025 This report is
YouTube
Instagram
Tiktok