Clay County Housing Market Update | September 2026

thumb-img
0 Comments
“Clay County FL Real Estate Market Update” in yellow lettering over a waterfront photo with covered boat docks and a boat ramp.

This report is for single family homes in Clay County for the towns of Fleming Island, Orange Park, Green Cove Springs and Middleburg.

The buyers are probably taking notice that the median sale price in Clay County was $357,500 in September, down $7,500 from the same month last year. There were 82 fewer homes on the market, and supply slipped from 4.88 to 4.67 months. The pace of the market barely changed. Not what the media tells you though is it? Homes averaged 85 days on the market compared with 86 last year, and they sold for an average of 94.3% of their original asking price. I know, slightly on the boring side!

Want to know what these numbers look like in your price range? Countywide statistics tell us what’s happening overall, but your price range and the area you’re buying or selling in can look very different. Contact me and I’ll help you take a closer look at what’s happening in your part of the Clay County market. Click here: Contact
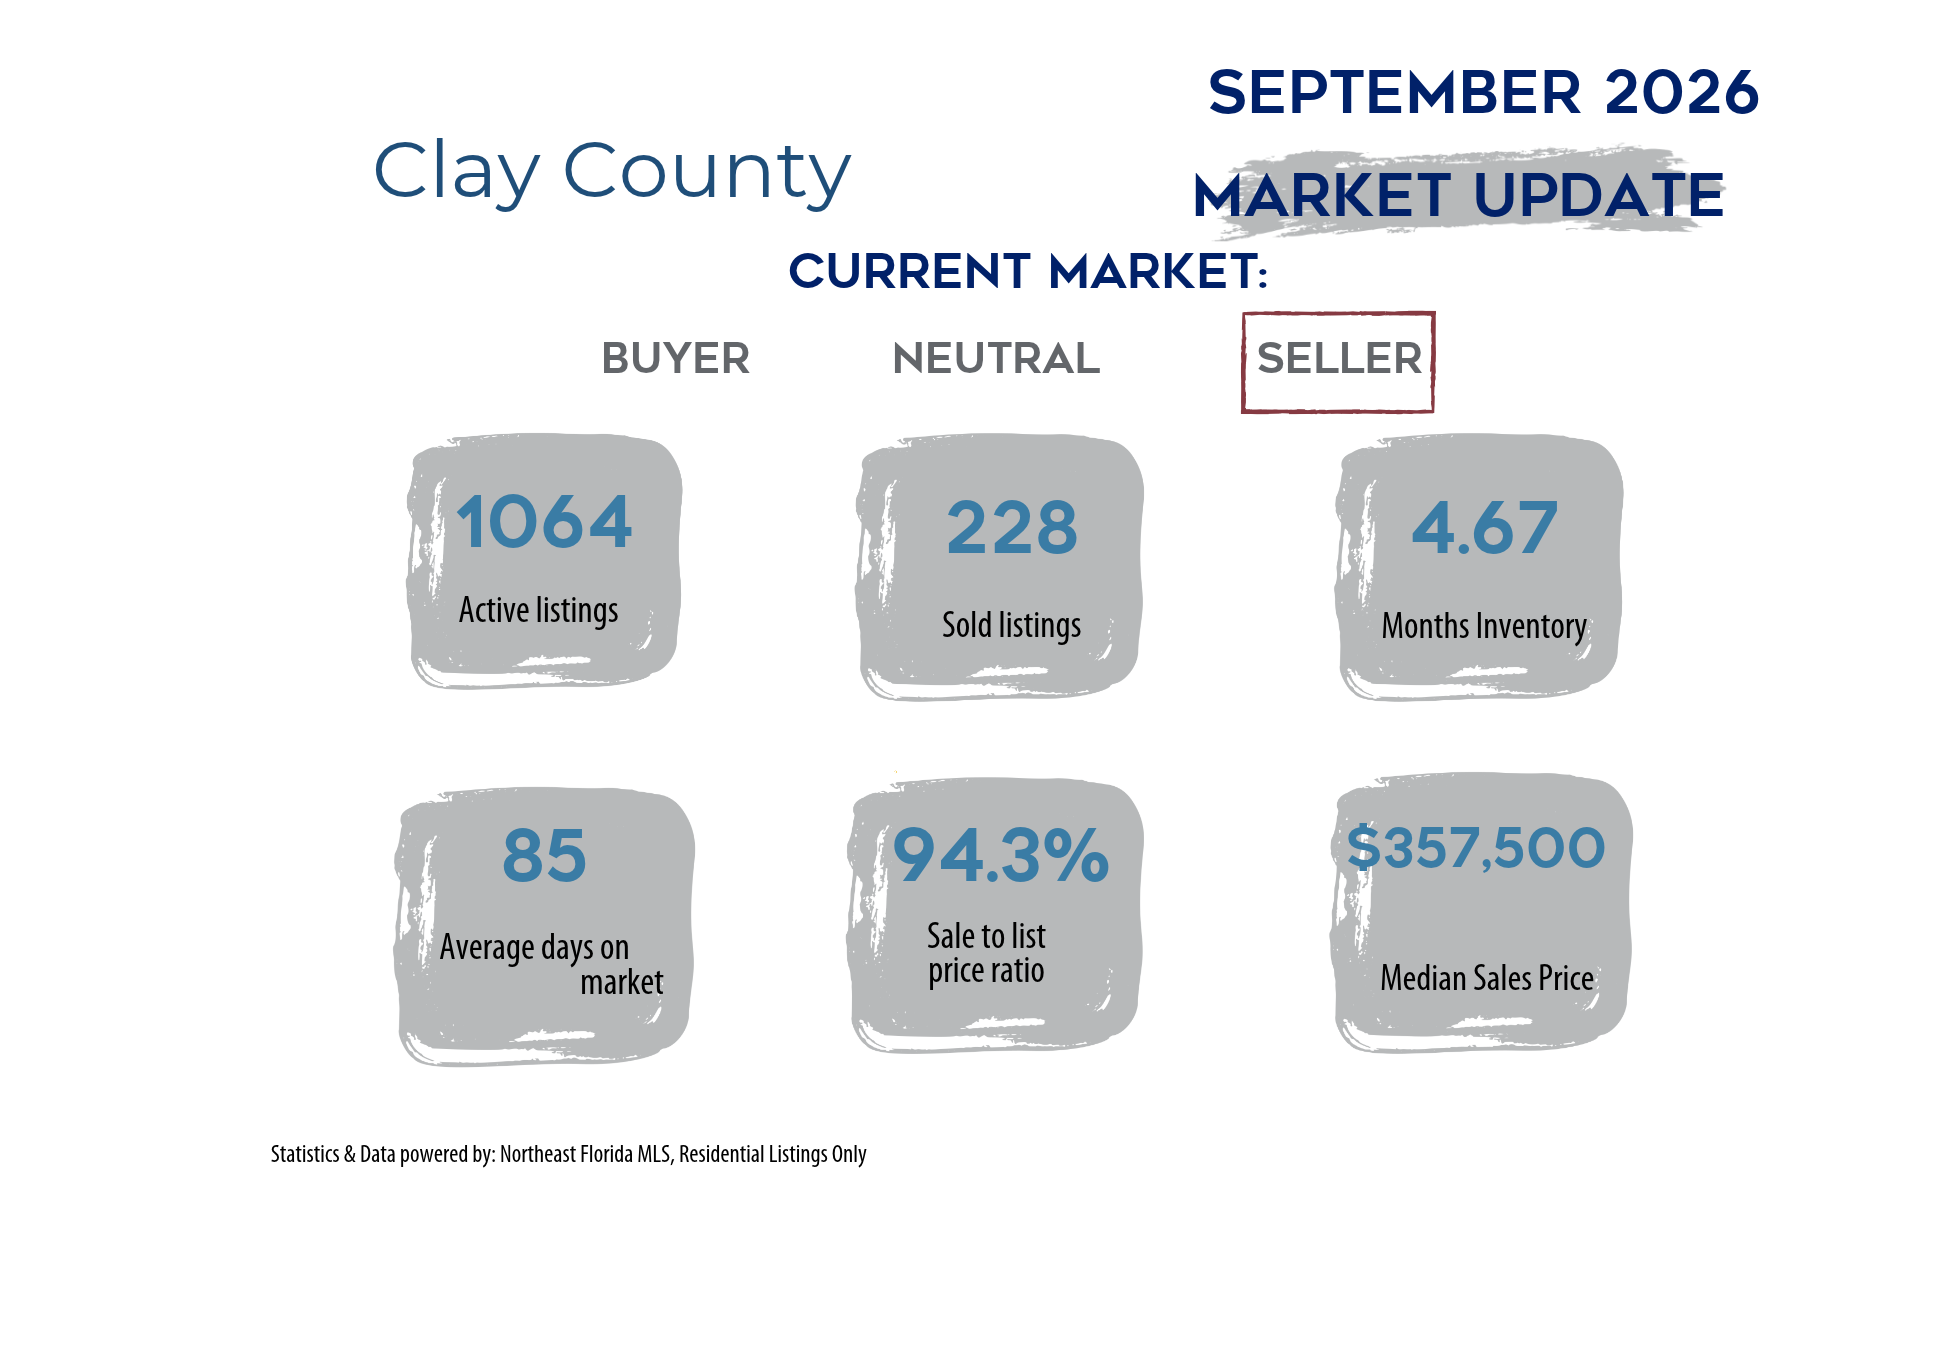
Clay County’s September 2026 seller’s market had 1,064 active listings, 228 sales, and 4.67 months of inventory. Homes averaged 85 days on the market and sold for 94.3% of their original list price, with a median sale price of $357,500.

The latest mortgage rates can be found at Mortgage Daily News. So when you see them they are in real time and do not reflect the September 2026 timeline. Just to give you a rough idea on payment, if the median sales price is $357,500, with 10% down and a rate of 7.30%, you are looking at a payment around $2,373.40 per month. This payment is just principal and interest, without taxes and insurance. Conventional loan.

What This Means If You’re Buying Right Now

If you’ve been waiting for prices to ease, September’s lower median is a little encouraging. You’ll have fewer homes to choose from than you did a year ago, so focus on what’s available in your price range and the areas you like. If a home catches your eye and it’s been sitting for a while, check what similar homes have sold for and how the asking price has changed. That can help you decide whether to ask for a lower price or help with closing costs.

If you want to know what you can actually get in today’s market, I can break that down for you, just message me:

What This Means If You’re Selling

You have a little less competition than sellers did last September, but homes are still averaging nearly three months on the market. When you set your price, look at recent sales in your neighborhood and the homes buyers could tour instead of yours. If you’re getting showings and no offers, look at the feedback and see how your price and condition compare with those other listings. No showings? That could point to your price.

I can show you exactly where your home would fall in today’s market. Click:
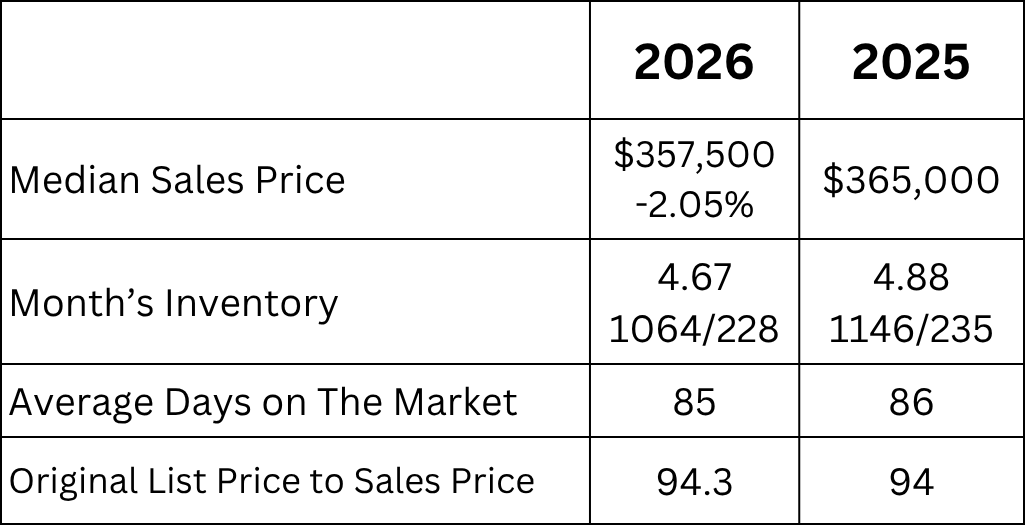
Clay County housing market in September 2026 compared with September 2025. The median sale price fell 2.05% from $365,000 to $357,500. Active listings fell from 1,146 to 1,064, and sales fell from 235 to 228. Inventory declined from 4.88 to 4.67 months. Average days on market fell from 86 to 85, and homes sold for 94.3% of their original list price, up from 94%.

Median Sales Price: Looking at sold homes it means that half the homes that sold were more than 357,500 and the other half were less than 357,500.

Month’s Inventory: Based on the number of actives and homes that have sold it would take 4.67 months to sell the active homes, if no other homes came on the market. How to determine what type of market we are experiencing:

Buyers’ Market: More than 7 months of Inventory

Balanced Market: From 5-7 months of Inventory

Sellers’ Market: Less than 5 months of inventory

Average Days on the Market: This is the average based on the time the house came on the market until is went under contract.

Original List Price to Sales Price: This is the percentage of what the home sold for compared to what it was originally listed for. Not what it was listed for at the time it went under contract.

I am, Pam Graham

I’m Pam Graham, a Northeast Florida real estate consultant, which includes Jacksonville, Clay & St John’s Counties. I break down the market in layman’s terms so you can make smart decisions—whether you’re buying, selling, or just keeping an eye on what’s happening.

Call/Text 904-910-3516

Email: pam@pamgraham.com
Categories:

Leave a Reply

Your email address will not be published. Required fields are marked *

This site uses Akismet to reduce spam. Learn how your comment data is processed.

976 Deer Chase Dr St. Augustine Fl 32086
976 Deer Chase Dr St. Augustine Fl 32086 Welcome home—where the drive in sets the
Jacksonville, Florida real estate market update graphic featuring a sunset waterfront scene with boats, a dock, and trees draped in Spanish moss. Jacksonville Housing Market September 2026: Prices Up 3.48%
This report is on single family homes in Jacksonville Florida Folks, Jacksonville’s housing market may
Clay County, Florida real estate market update graphic featuring a waterfront community with a lake, green lawn, palm trees, buildings, and a waterslide beneath a blue sky with large white clouds. Clay County Housing Market August 2026: Prices Rise as Inventory Falls
This report is for single family homes in Clay County for the towns of Fleming
Jacksonville, Florida real estate market update graphic featuring a waterfront sunset scene with boats and a dock. Large text reads “Jacksonville FL Real Estate Market Update.” Jacksonville FL Real Estate Market: Are Home Prices Starting to Fall? August 2026 Edition
This report is on single family homes in Jacksonville Florida It has begun,,,,,,, the crash
Vilano Beach with text that says St Johns County Real Estate Market Update St. Johns County Housing Market August 2026: Prices Up, Inventory Down
Folks, I know it feels like a buyer’s market, but the numbers don’t show that.
St. Johns County, Florida real estate market update graphic featuring the Bridge of Lions in St. Augustine spanning the Matanzas River beneath a clear blue sky. St. Johns County Housing Market July 2026: Inventory Falls While Sales Increase
The St. Johns County housing market continues to show an interesting contrast between home prices
Clay County, Florida real estate market update graphic featuring a waterfront community with a lake, green lawn, palm trees, buildings, and a waterslide beneath a blue sky with large white clouds. Clay County Housing Market July 2026: Prices Dip While Homes Sell Faster
This report is for single family homes in Clay County for the towns of Fleming
Jacksonville, Florida real estate market update graphic featuring a sunset waterfront scene with boats, a dock, and trees draped in Spanish moss. Jacksonville Housing Market July 2026: Prices Rise as Inventory Falls
This report is on single family homes in Jacksonville Florida Looking at the median sales
St. Johns County, Florida real estate market update graphic featuring a sunny beach scene with ocean waves, people along the shoreline, and beachfront homes in the background. St. Johns County Housing Market June 2026: Inventory Drops as Home Sales Rise
The St. Johns County housing market looked very different in June 2026 compared to June
Clay County, Florida real estate market update graphic featuring a waterfront scene with blue water, a shoreline, and a covered dock beneath a bright blue sky. Clay County Housing Market June 2026: Prices Hold Steady as Inventory Falls
This report is for single family homes in Clay County for the towns of Fleming
YouTube
Instagram
Tiktok