Includes single family homes in St Johns, St Augustine, Nocatee, Ponta Vedra, Fruit Cove, Orangedale, Switzerland and Julington Creek.
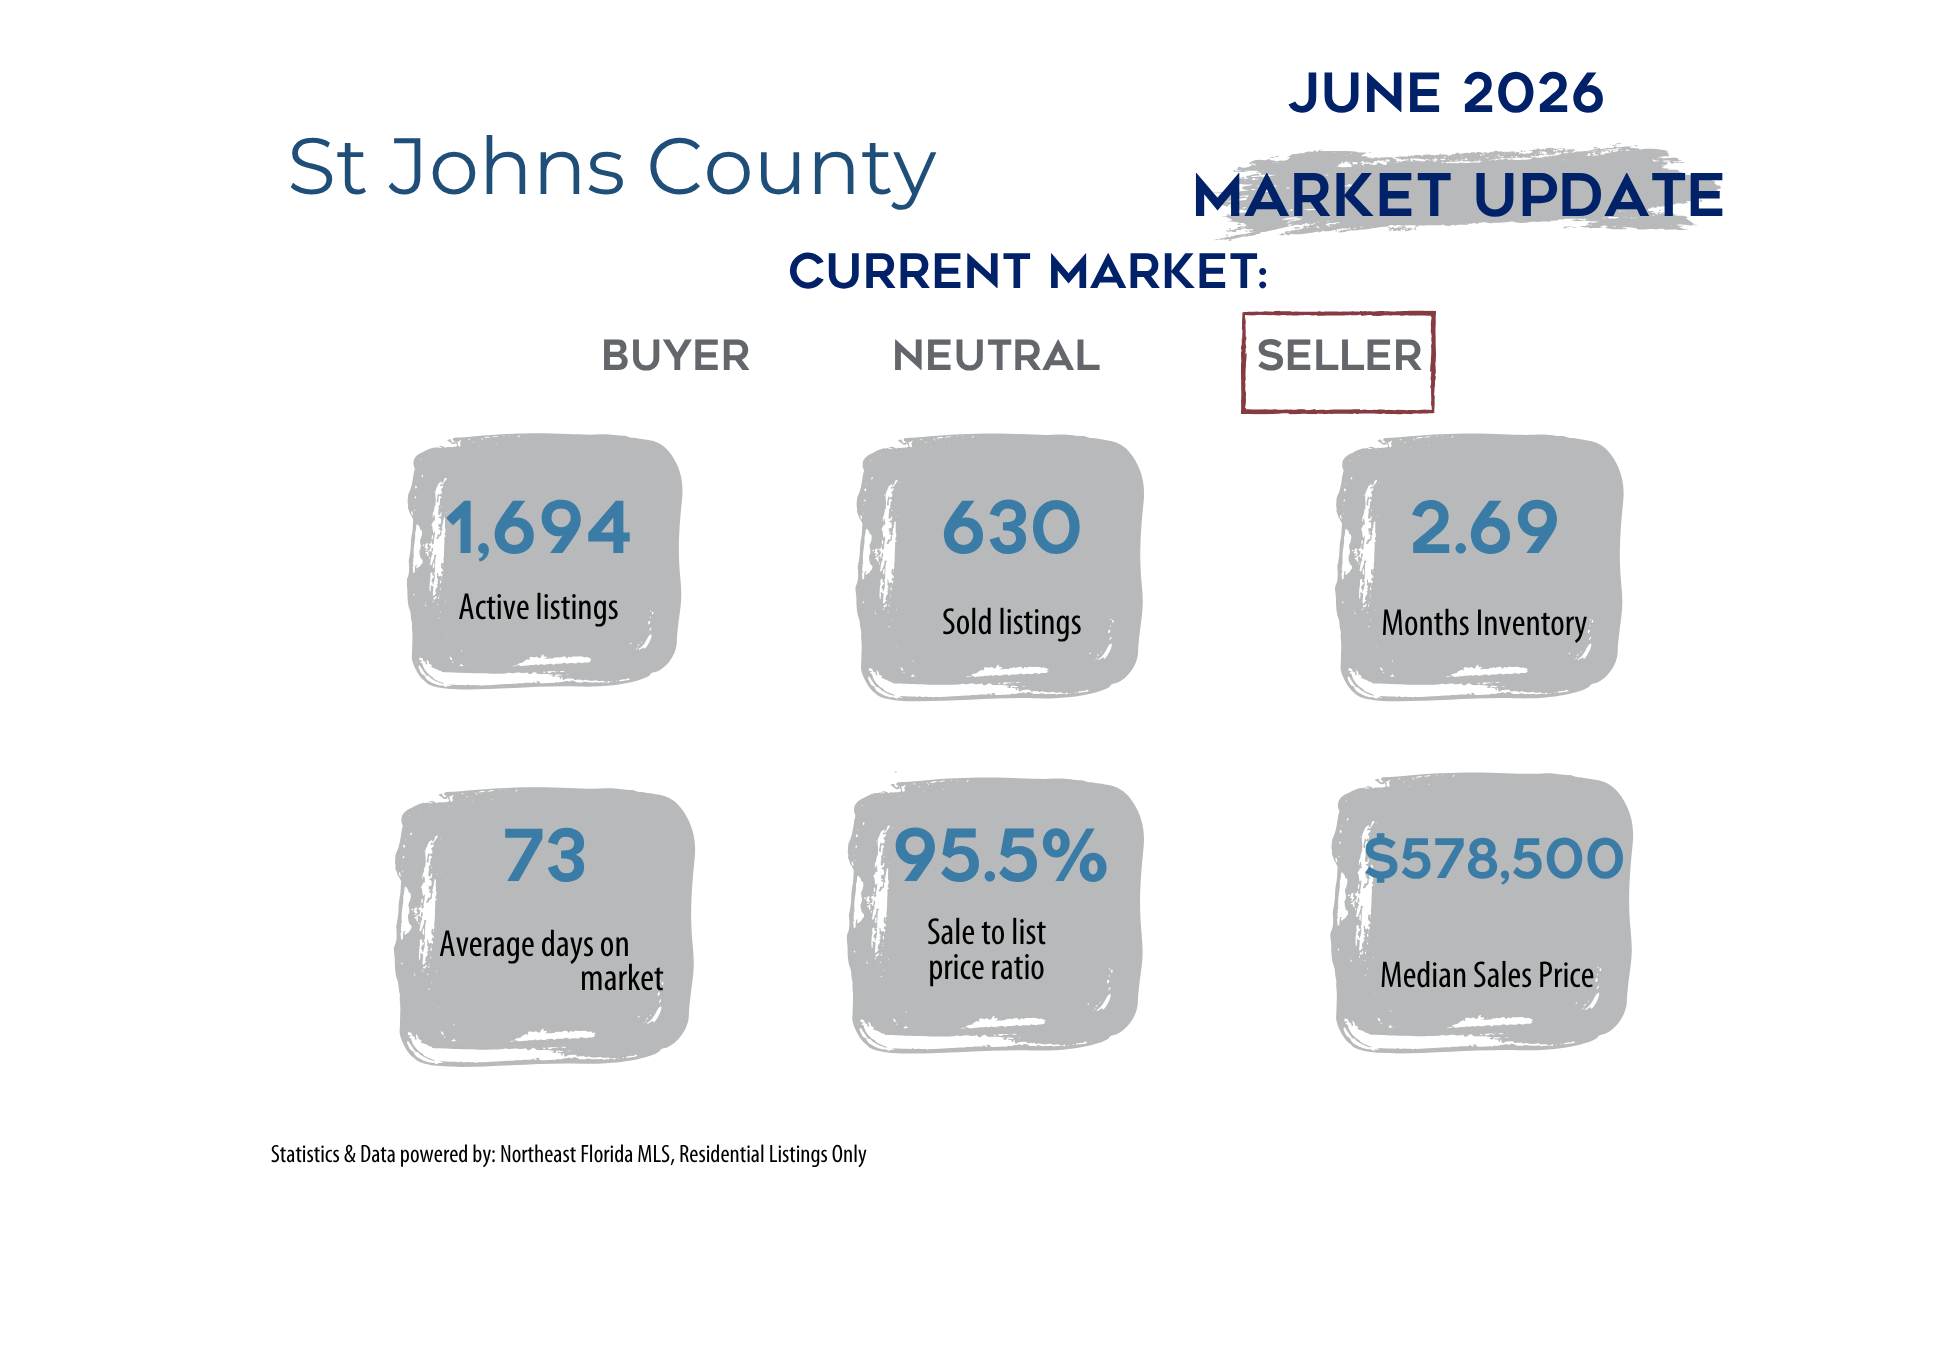
The St. Johns County housing market looked very different in June 2026 compared to June 2025, even though the median sales price barely changed. The median sales price was $578,500, up just 0.56% from $575,250 last year. When it comes to prices, that’s essentially a flat year-over-year market.
Inventory, however, tells a much different and darker story. Okay, that was a little dramatic. There were 1,694 active listings in June 2026 compared to 2,498 in June 2025, a drop of 804 homes. At the same time, sales increased from 510 to 630. That combination pushed months of inventory from 4.90 months last year all the way down to 2.69 months this year.
Homes also sold faster, with average days on the market falling from 88 to 73 days. The original list price to sales price ratio increased from 93.9% to 95.5%. So while home prices haven’t changed much, buyers are choosing from significantly less inventory, more homes are selling, and sellers are getting closer to their original asking prices.
What This Means If You’re Buying Right Now
For buyers, the good news is that the median sales price hasn’t taken another big jump. At $578,500, it’s only 0.56% higher than it was last June. There is also still some negotiating room, with homes selling for an average of 95.5% of their original list price.
The challenge is that you have considerably less inventory to choose from. There were more than 800 fewer active listings than there were a year ago, while 120 more homes sold. Which is crazy to think about. That means buyers need to pay attention when a well-priced home that fits their needs comes on the market. You can still negotiate, particularly if a home hasn’t already had significant price reductions, but the numbers don’t suggest buyers have as much leverage as they did last year. If you want to know what you can actually get in today’s market, I can break that down for you, just message me:
What This Means If You’re Selling
For sellers, the June numbers are encouraging. St. Johns County had 2.69 months of inventory compared to 4.90 months last year, more homes sold, and properties spent 15 fewer days on the market on average. Sellers also received 95.5% of their original list price compared to 93.9% last year. Wish we could look back to last year to see the difference.
But this still isn’t a market where pricing and condition don’t matter. The median sales price barely increased, and the 95.5% original-list-to-sale-price ratio tells us buyers are still negotiating. If you’re thinking about selling, getting the condition and pricing right from the beginning can help your home stand out and potentially avoid sitting on the market and going through multiple price reductions. If you’re thinking about selling, I can show you exactly where your home would fall in today’s market. Click:
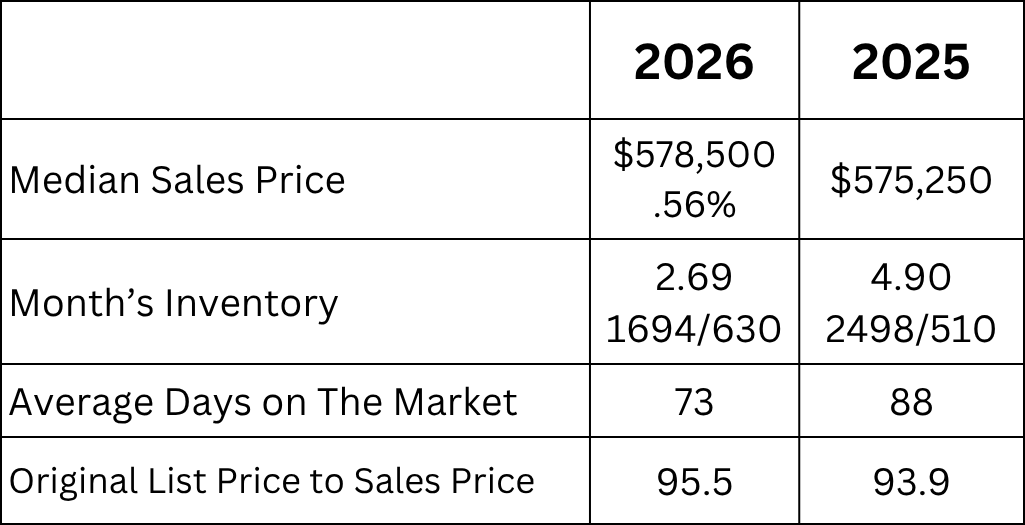
Median Sales Price: Looking at sold homes it means that half the homes that sold were more than 578,500 and the other half were less than 578,500.
Month’s Inventory: Based on the number of actives and homes that have sold it would take 2.69 months to sell the active homes, if no other homes came on the market. How to determine what type of market we are experiencing:
Buyers’ Market: More than 7 months of Inventory
Balanced Market: From 5-7 months of Inventory
Sellers’ Market: Less than 5 months of inventory
Average Days on the Market: This is the average based on the time the house came on the market until is went under contract.
Original List Price to Sales Price: This is the percentage of what the home sold for compared to what it was originally listed for. Not what it was listed for at the time it went under contract.

I’m Pam Graham, a Northeast Florida real estate consultant, which includes Jacksonville, Clay & St John’s Counties. I break down the market in layman’s terms so you can make smart decisions—whether you’re buying, selling, or just keeping an eye on what’s happening.
Call/Text 904-910-3516
Email: pam@pamgraham.com