April 2026 St. Johns County Market Update: Home Prices Rise While Inventory Tightens
Includes single family homes in St Johns, St Augustine, Nocatee, Ponta Vedra, Fruit Cove, Orangedale, Switzerland and Julington Creek.
Last year in April there were around 600 more homes on the market than this year. That’s a big difference. Scroll down to the number chart, the graph chart won’t show last years numbers. Just this years. I started doing two different types for easy to read and one for the more data driven folks. What you won’t hear from the media is that we are still seeing a seller’s market, but just not one that the buyers have to give away all their contingencies to get a home.
What This Means If You’re Buying Right Now
Buyers, inventory levels coming down, does mean less homes available to look at. It is still better than that 2020-2022 time frame, which means though the numbers show a seller’s market, there is more opportunities for buyers. If you want to know what you can actually get in today’s market, I can break that down for you, just message me:
What This Means If You’re Selling
Sellers you are still seeing things move for you, if you are priced competitively and your home is visually appealing. We’re seeing homes reduce price by around 6%, which means buyers are negotiating more than they were a year ago. Overpricing right now can cause your home to sit longer than expected. If you’re thinking about selling, I can show you exactly where your home would fall in today’s market. Click:
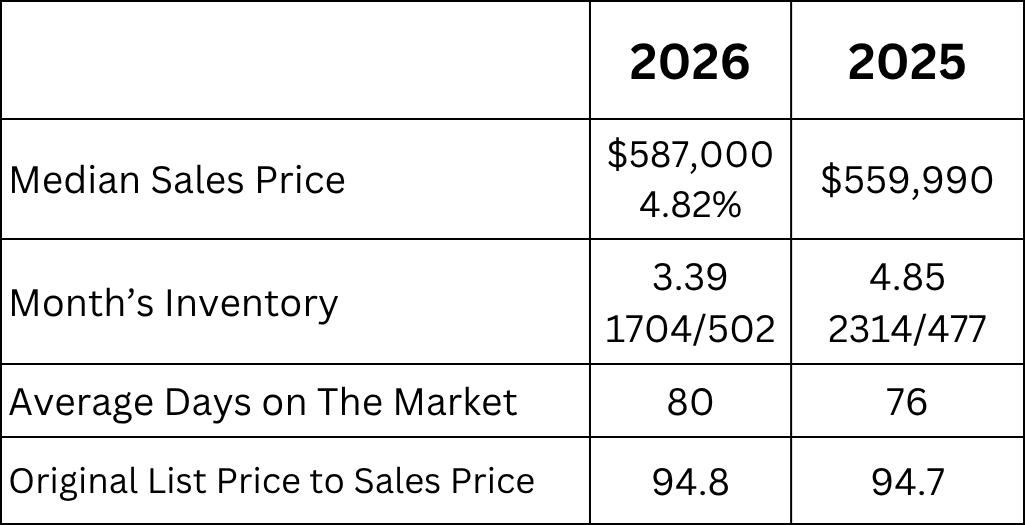
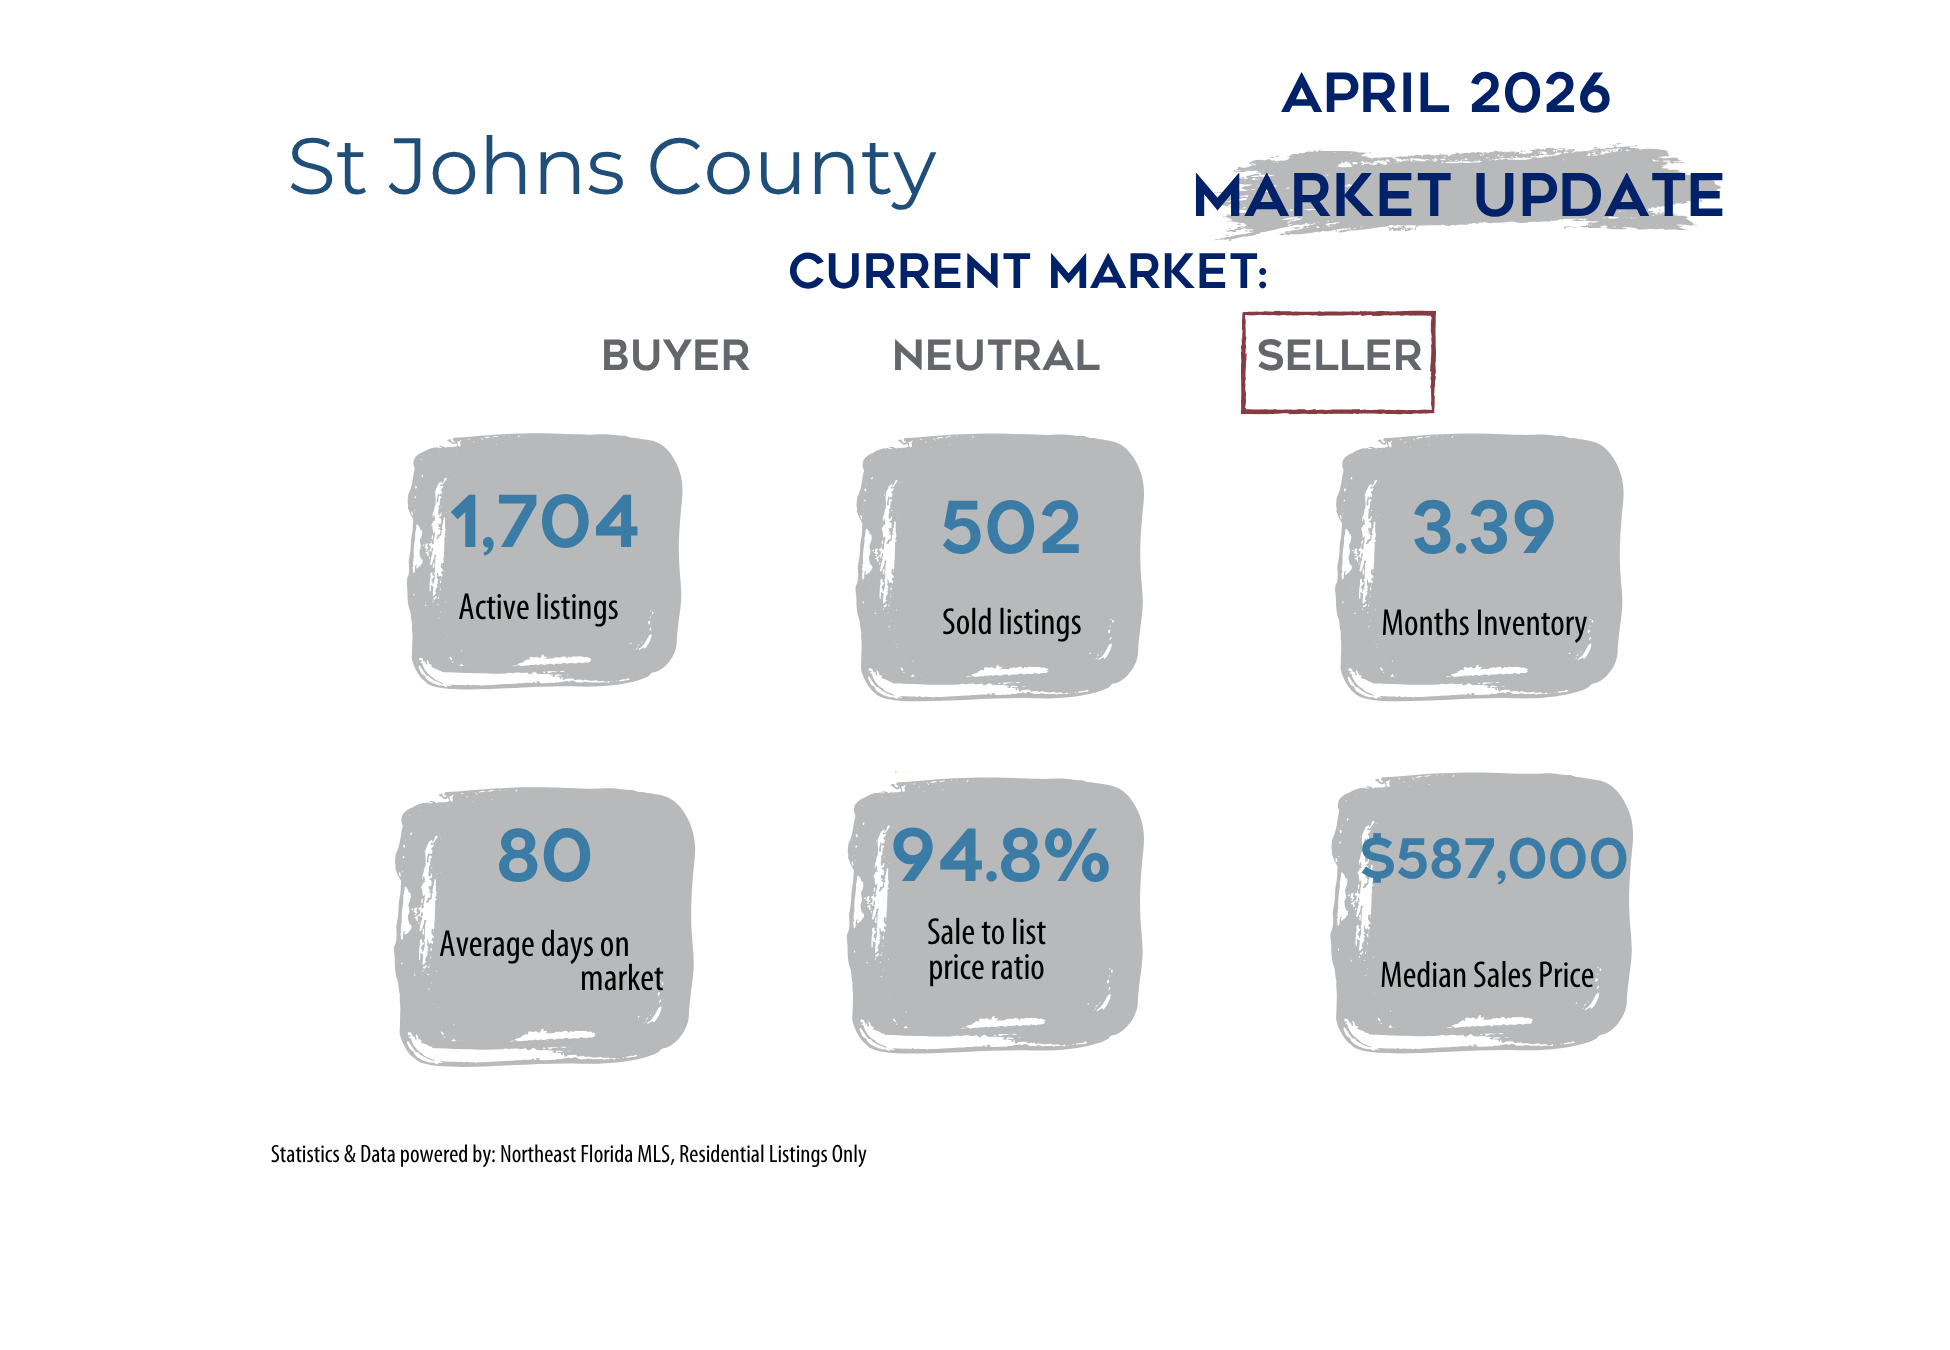
Median Sales Price: Looking at sold homes it means that half the homes that sold were more than 587,000 and the other half were less than 587,000.
Month’s Inventory: Based on the number of actives and homes that have sold it would take 3.39 months to sell the active homes, if no other homes came on the market. How to determine what type of market we are experiencing:
Buyers’ Market: More than 7 months of Inventory
Balanced Market: From 5-7 months of Inventory
Sellers’ Market: Less than 5 months of inventory
Average Days on the Market: This is the average based on the time the house came on the market until is went under contract.
Original List Price to Sales Price: This is the percentage of what the home sold for compared to what it was originally listed for. Not what it was listed for at the time it went under contract.

I’m Pam Graham, a Northeast Florida real estate consultant, which includes Jacksonville, Clay & St John’s Counties. I break down the market in layman’s terms so you can make smart decisions—whether you’re buying, selling, or just keeping an eye on what’s happening.
Call/Text 904-910-3516
Email: pam@pamgraham.com