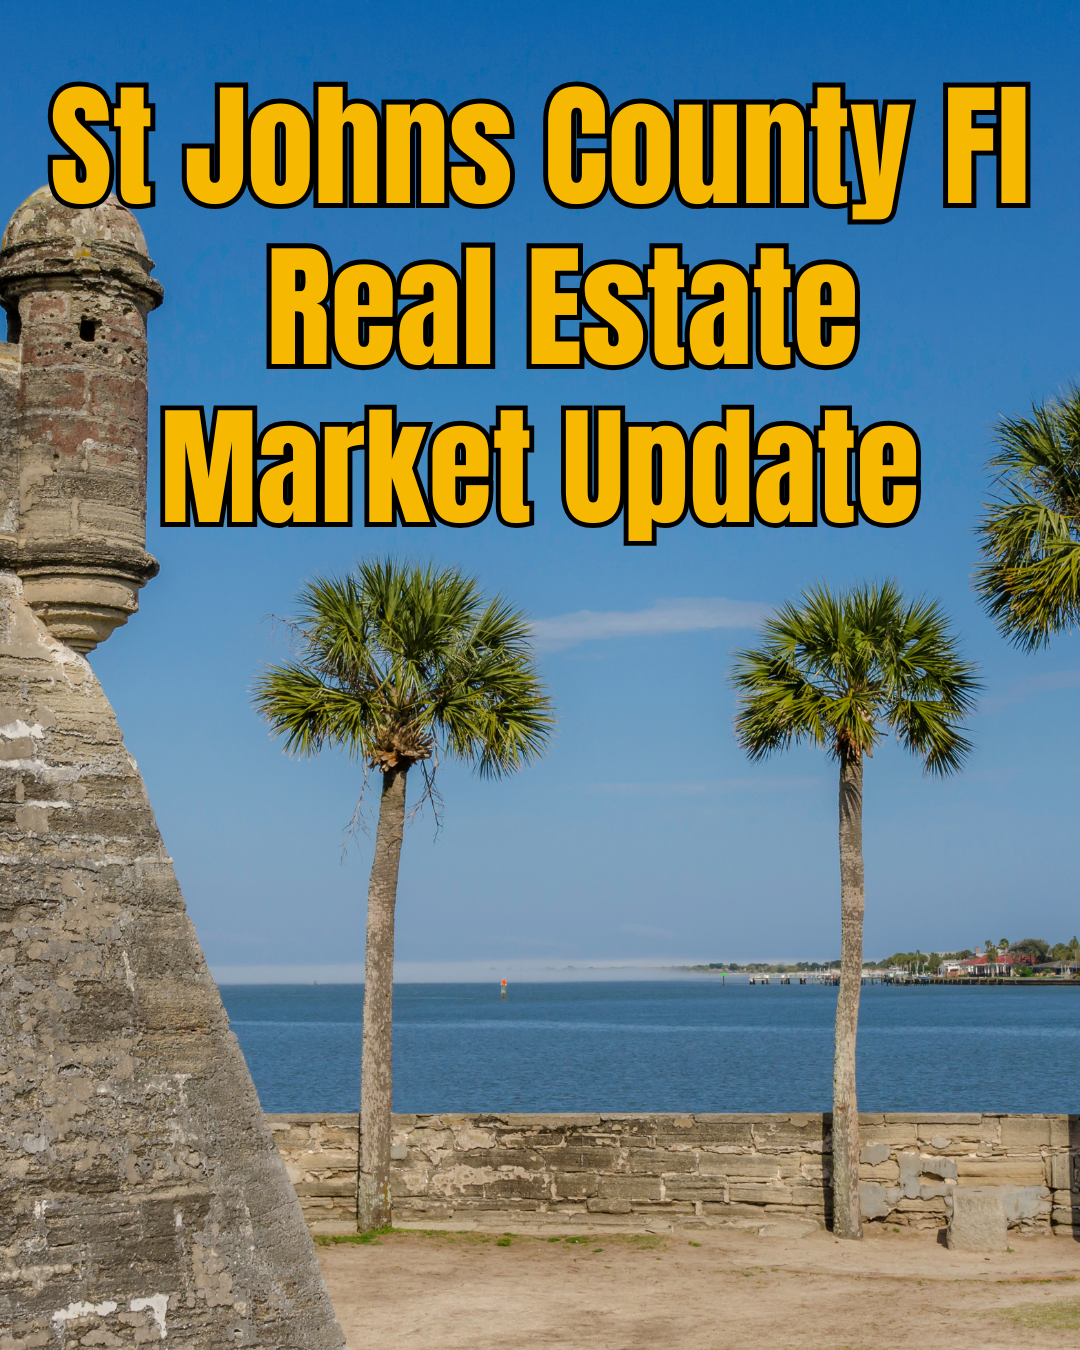
St. Johns County FL Market Report: December Surge Now, New-Year Shift Next
The trend is continuing in St. John’s County, just like Clay County and Jacksonville. That trend is more houses sold in December, and the months inventory level came down. That’ll probably change next month as we start a new year. Many buyers are trying to close in December so they can get into their house before the end of the year to be able to claim Homestead exemption. Which saves you some money on your property taxes.
Stay tune for 2026 when we start to see the affordability in housing tackled by the White House. I’ll be writing about those in the very near future.
Want to see the current mortgage interest rates? Check out the Mortgage Daily News for the latest.
What’s My Home Worth?
Thinking of selling your home? Click below to complete a form, then receive a market analysis within 24 hours.
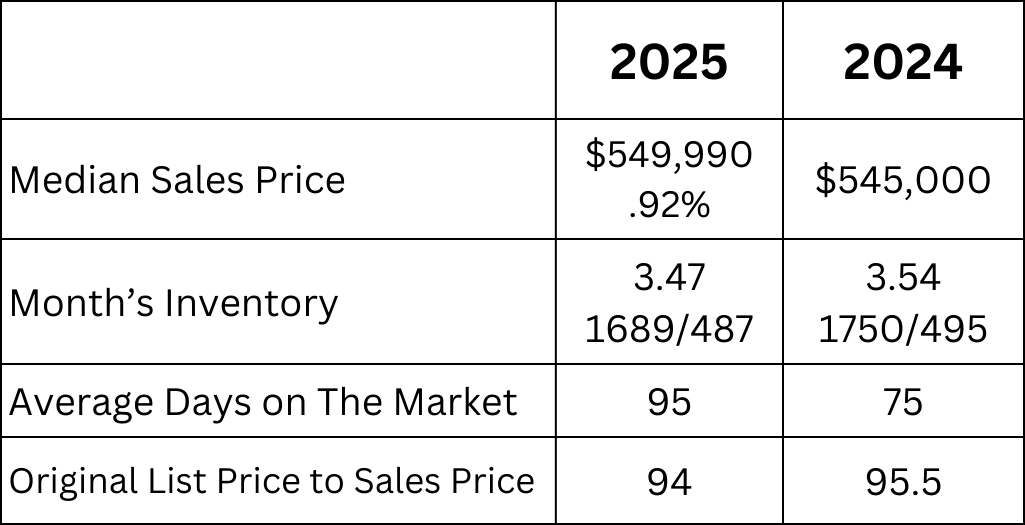
Median Sales Price: Looking at sold homes it means that half the homes that sold were more than 549,000 and the other half were less than 549,000.
Month’s Inventory: Based on the number of actives and homes that have sold it would take 3.47months to sell the active homes, if no other homes came on the market. How to determine what type of market we are experiencing:
Buyers’ Market: More than 7 months of Inventory
Balanced Market: From 5-7 months of Inventory
Sellers’ Market: Less than 5 months of inventory
Average Days on the Market: This is the average based on the time the house came on the market until is went under contract.
Original List Price to Sales Price: This is the percentage of what the home sold for compared to what it was originally listed for. Not what it was listed for at the time it went under contract.